Density scatter plot
<sample>_duprateExpDens.{png,svg}
In DNA sequencing, PCR duplicates are straightforward to identify and remove: reads with identical alignment coordinates are likely amplification artifacts. In RNA-seq, the situation is more nuanced.
Highly expressed genes produce many RNA fragments. When sequencing depth is sufficient, some of these independent fragments will share the same start and end positions purely by chance. These are natural duplicates — biologically real, not PCR artifacts. Removing them would distort expression estimates.
dupRadar addresses this by analyzing duplication rates in the context of expression level. Rather than applying a blanket duplicate removal, it models the expected relationship between how highly a gene is expressed and what fraction of its reads are marked as duplicates.
The key insight: at low expression levels, duplicates are almost certainly PCR artifacts. At high expression levels, a baseline level of duplication is expected and biologically meaningful.
Duplicate rate analysis helps answer critical quality questions about an RNA-seq library:
This information is essential for experiment QC, troubleshooting library preparation protocols, and deciding whether to include a sample in downstream analysis.
dupRadar fits a logistic regression to the relationship between expression level and duplication rate. RustQC implements this same model using iteratively reweighted least squares (IRLS).
The model:
duplication_rate = 1 / (1 + exp(-(intercept + slope * x)))where x is log10(reads per kilobase).
Intercept: Controls the baseline duplication rate at zero expression.
Slope: Controls how steeply duplication rises with expression.
| Intercept | Slope | Interpretation |
|---|---|---|
| Low (~0) | Moderate-high | Good library. Duplicates are expression-dependent. |
| High (>0.5) | Low | Over-amplified. Duplicates everywhere. |
| High (>0.5) | High | Over-amplified, but expression signal still visible. |
| Low (~0) | Very low | Good complexity, very little duplication at any level. |
All dupRadar output files use the BAM file stem as a prefix (e.g., sample.bam produces sample_dupMatrix.txt) and are written to a dupradar/ subdirectory under the output directory. Use --flat-output to write all files directly to the output directory instead. Each output can be individually enabled or disabled via the configuration file.
File: <sample>_dupMatrix.txt
A tab-separated file with one row per gene and 14 columns. This is the core data table from which all other dupRadar outputs are derived.
| Column | Description |
|---|---|
ID | Gene identifier from the GTF |
geneLength | Gene length in base pairs (non-overlapping exon bases) |
allCountsMulti | Total read count including multi-mappers |
filteredCountsMulti | Read count excluding duplicates, including multi-mappers |
dupRateMulti | Duplication rate with multi-mappers: (all - filtered) / all |
dupsPerIdMulti | Number of duplicate reads (multi-mapper inclusive) |
RPKMulti | Reads per kilobase (multi-mapper inclusive) |
RPKMMulti | Reads per kilobase per million mapped reads (multi-mapper inclusive) |
allCounts | Total read count (unique mappers only) |
filteredCounts | Read count excluding duplicates (unique mappers only) |
dupRate | Duplication rate (unique mappers only) |
dupsPerIdUnique | Number of duplicate reads (unique mappers only) |
RPK | Reads per kilobase (unique mappers only) |
RPKM | Reads per kilobase per million mapped reads (unique mappers only) |
Genes with zero reads have a duplication rate of 0 and RPK/RPKM values of 0. The format is identical to R dupRadar’s _dupMatrix.txt output.
File: <sample>_intercept_slope.txt
A two-line text file containing the intercept and slope of the fitted logistic regression model:
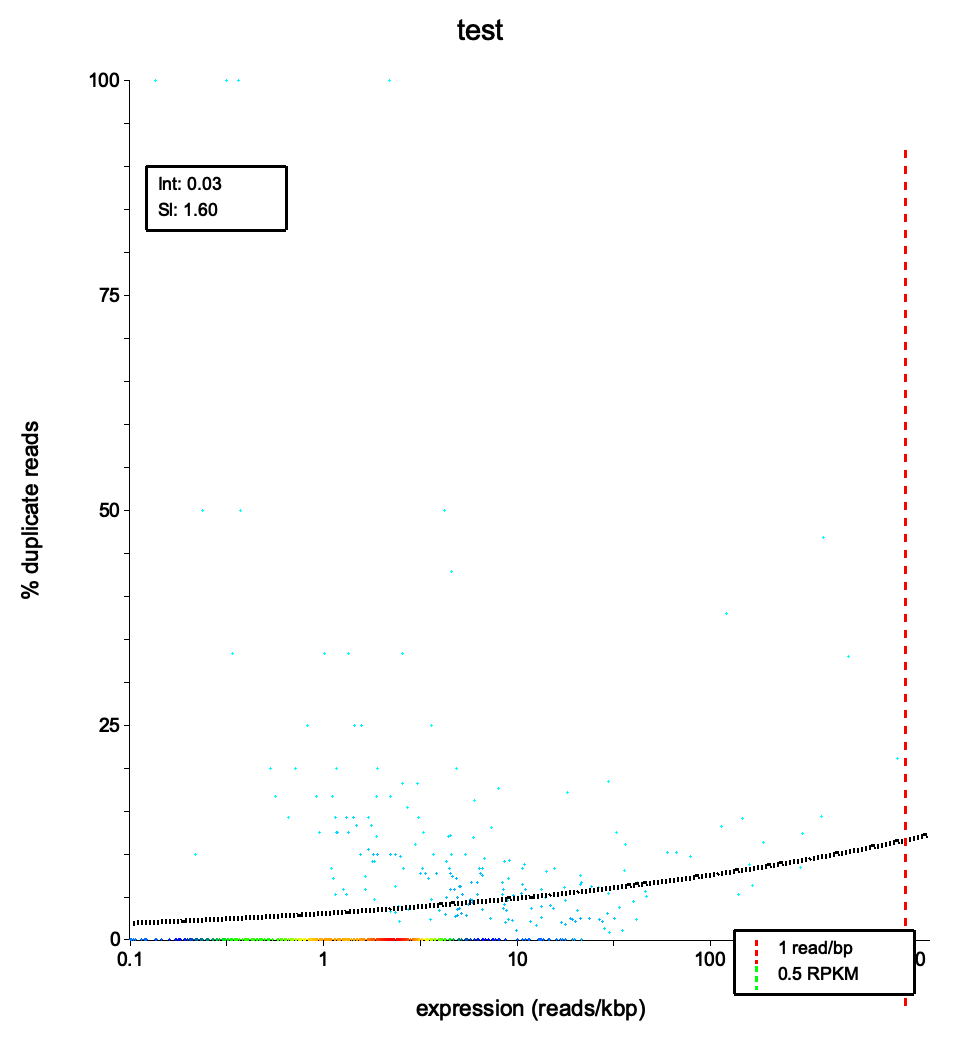
intercept 0.03186slope 1.60189These parameters define the fitted curve: y = 1 / (1 + exp(-(intercept + slope * x))), where x is log10(reads/kbp) and y is the duplication rate.
RustQC generates three diagnostic plots in both PNG and SVG formats. See the Interpreting plots section below for how to read each plot.
Density scatter plot
<sample>_duprateExpDens.{png,svg}
Duplication rate boxplot
<sample>_duprateExpBoxplot.{png,svg}
Expression histogram
<sample>_expressionHist.{png,svg}
<sample>_intercept_slope_mqc.tsv — Intercept and slope values in MultiQC general statistics format.<sample>_duprateExpDensCurve_mqc.txt — Fitted duplication rate curve data points for MultiQC line plot visualization.These files are designed for integration with MultiQC, enabling dupRadar results to be included in multi-sample QC reports.
RustQC generates the same three visualizations as the original dupRadar R package and follows the same conventions. All plots are produced in both PNG and SVG formats.
File: <sample>_duprateExpDens.png / .svg
This is the primary diagnostic plot, showing the relationship between gene expression level and duplication rate.
Expected patterns in a well-prepared library:
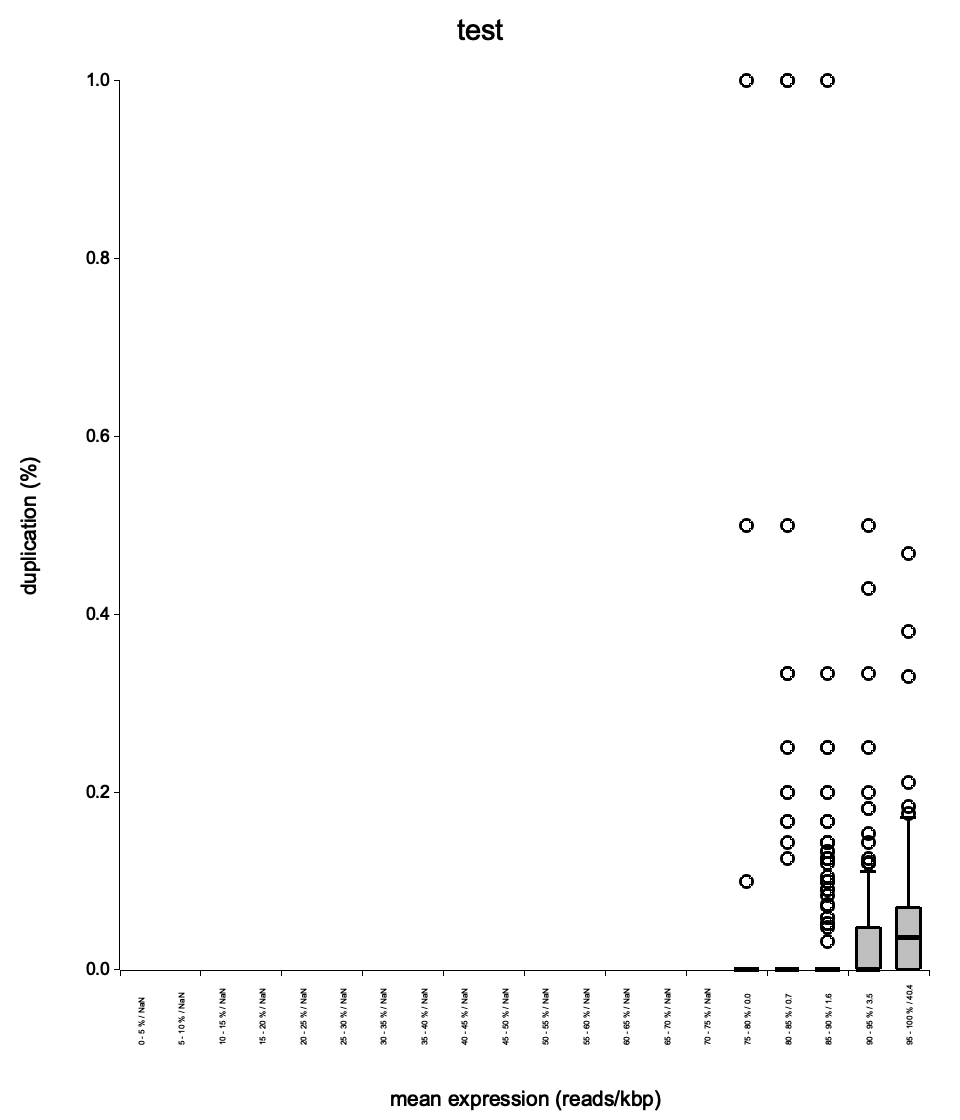
File: <sample>_duprateExpBoxplot.png / .svg
Shows the distribution of duplication rates across expression-level bins, providing a complementary view to the density scatter plot.
Boxes should be near zero at low expression and gradually rise at higher expression levels. Very wide boxes at low expression suggest inconsistent library preparation. The median line within each box should track the general trend seen in the density scatter plot. This plot helps determine whether high duplication rates are expression-dependent (expected) or uniform across all expression levels (problematic).
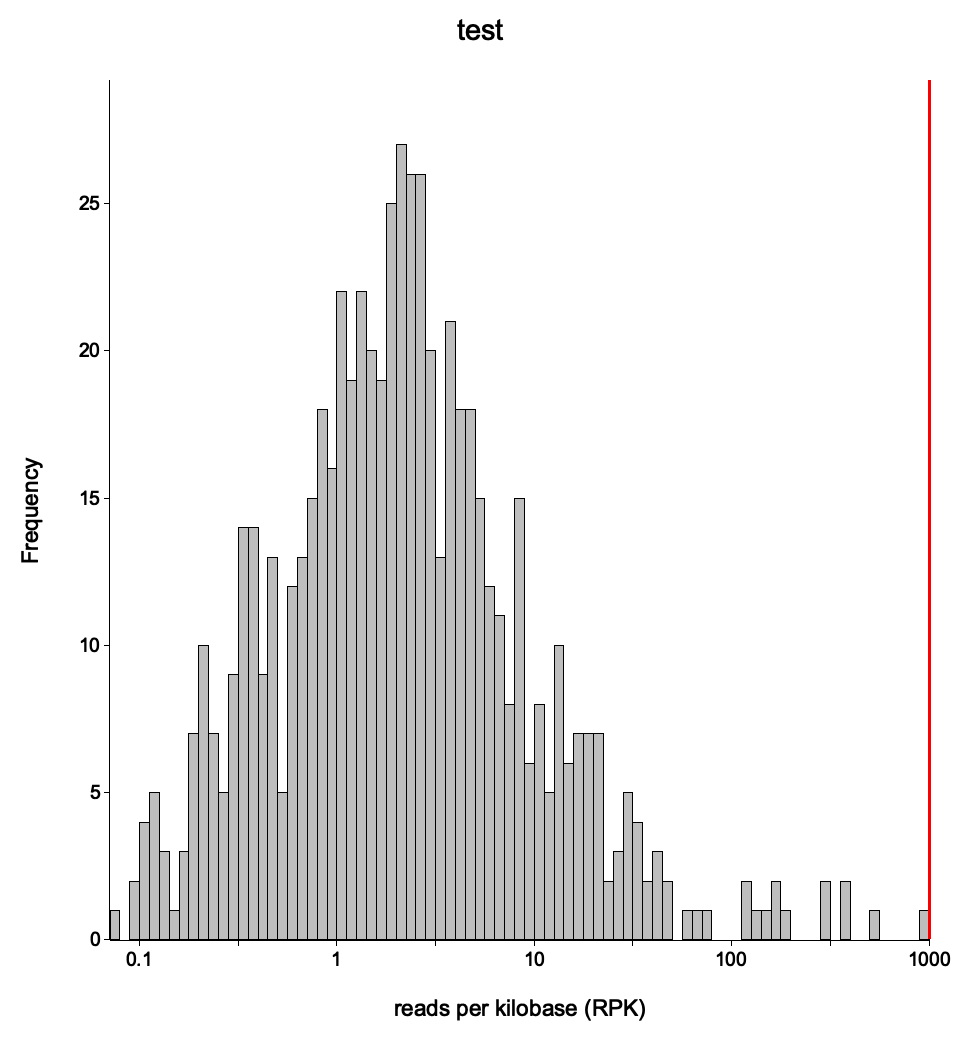
File: <sample>_expressionHist.png / .svg
A histogram of gene expression levels across all genes in the annotation.
A bimodal distribution is common: one peak near zero (unexpressed or very lowly expressed genes) and another peak at moderate expression levels. The position and height of the peaks indicate the dynamic range of the experiment. A narrow distribution shifted to the left suggests low overall sequencing depth or poor library complexity.
If genes with few reads already show high duplication rates, this indicates technical PCR duplication rather than biological signal. The density scatter plot will show points clustered in the upper-left region, and the fitted curve will have a high intercept.
If the duplication rate is uniformly high across all expression levels (a flat, high curve), this suggests a severe PCR amplification issue — the library has very low complexity and most reads are duplicates regardless of gene expression.
Duplication rates near zero across all expression levels, including highly expressed genes, may indicate that duplicates were not properly marked in the BAM file. Verify that a duplicate-marking tool was run before RustQC.
| Indicator | Good library | Problematic library |
|---|---|---|
| Intercept | Close to 0 | Above 0.5 |
| Low-expression genes | Near-zero dup rate | Elevated dup rate |
| Curve shape | Gradual rise | Flat and high, or steep early rise |
| Boxplot spread | Tight boxes at low expression | Wide boxes everywhere |
Use a YAML configuration file to control which dupRadar outputs are generated. All outputs are enabled by default. Set any to false to skip generation:
dupradar: dup_matrix: true intercept_slope: true density_scatter_plot: true boxplot: true expression_histogram: true multiqc_intercept: true multiqc_curve: true