RSeQC Benchmarks
RustQC reimplements 7 RSeQC tools plus TIN (Transcript Integrity Number) analysis as built-in analyses that run in a single pass over the BAM file. It also produces Qualimap-compatible gene body coverage output. This page compares the output of each tool against the originals on a 10 GB paired-end BAM file (GM12878, ENCODE).
Performance
Section titled “Performance”All RSeQC tools run together in the same single-pass BAM reading that also produces dupRadar, featureCounts, preseq, samtools, and gene body coverage output. The timings below show the original Python RSeQC tools run individually versus RustQC running all tools in a single pass with 10 threads.
| Tool | RSeQC (Python) | RustQC |
|---|---|---|
| bam_stat | 6m 07s | — |
| infer_experiment | 7s | — |
| read_duplication | 29m 43s | — |
| read_distribution | 6m 00s | — |
| junction_annotation | 4m 37s | — |
| junction_saturation | 6m 32s | — |
| inner_distance | 1m 09s | — |
| tin.py | ~45m | — |
| Total (RSeQC only) | ~99m | — |
| All outputs | — | 5m 13s |
RustQC produces all RSeQC outputs (plus dupRadar, featureCounts, preseq, samtools, and gene body coverage) in under 6 minutes — a ~19x speedup over running the RSeQC tools alone.
bam_stat
Section titled “bam_stat”Summarises key alignment statistics from the BAM file.
All values are identical between RSeQC and RustQC:
| Metric | RSeQC | RustQC |
|---|---|---|
| Total records | 185,718,543 | 185,718,543 |
| QC failed | 0 | 0 |
| Duplicates | 133,912,519 | 133,912,519 |
| Non-primary | 10,620,822 | 10,620,822 |
| Mapped (MAPQ >= cutoff) | 39,827,099 | 39,827,099 |
| Splice reads | 12,013,939 | 12,013,939 |
| Non-splice reads | 27,813,160 | 27,813,160 |
| Proper pairs | 39,797,926 | 39,797,926 |
infer_experiment
Section titled “infer_experiment”Infers the strandedness of an RNA-Seq experiment by sampling reads and comparing their strand to annotated gene models.
| Metric | RSeQC | RustQC |
|---|---|---|
| Failed to determine | 0.0666 | 0.0667 |
| Fraction sense (1++,1—,2+-,2-+) | 0.0116 | 0.0116 |
| Fraction antisense (1+-,1-+,2++,2—) | 0.9218 | 0.9218 |
The strandedness fractions match to 4 decimal places. The 0.0001 difference in the “failed” fraction is last-digit rounding.
read_distribution
Section titled “read_distribution”Calculates how mapped reads are distributed over genomic features (CDS, UTR, introns, intergenic regions).
All values are identical:
| Feature | RSeQC Tags | RustQC Tags | RSeQC Tags/Kb | RustQC Tags/Kb |
|---|---|---|---|---|
| CDS Exons | 33,261,445 | 33,261,445 | 939.13 | 939.13 |
| 5’ UTR Exons | 2,634,396 | 2,634,396 | 76.25 | 76.25 |
| 3’ UTR Exons | 8,459,978 | 8,459,978 | 150.40 | 150.40 |
| Introns | 7,390,637 | 7,390,637 | 5.12 | 5.12 |
| TSS up 1kb | 65,636 | 65,636 | — | — |
| TSS up 5kb | 149,678 | 149,678 | — | — |
| TSS up 10kb | 206,943 | 206,943 | — | — |
| TES down 1kb | 147,759 | 147,759 | — | — |
| TES down 5kb | 373,552 | 373,552 | — | — |
| TES down 10kb | 447,114 | 447,114 | — | — |
read_duplication
Section titled “read_duplication”Calculates read duplication rates at both the sequence and mapping position level.
The Python RSeQC reference files for the large benchmark were empty (0 bytes) due to the tool running out of memory with this dataset. RustQC produces complete output with no memory issues, generating both position-based and sequence-based duplication rate tables.
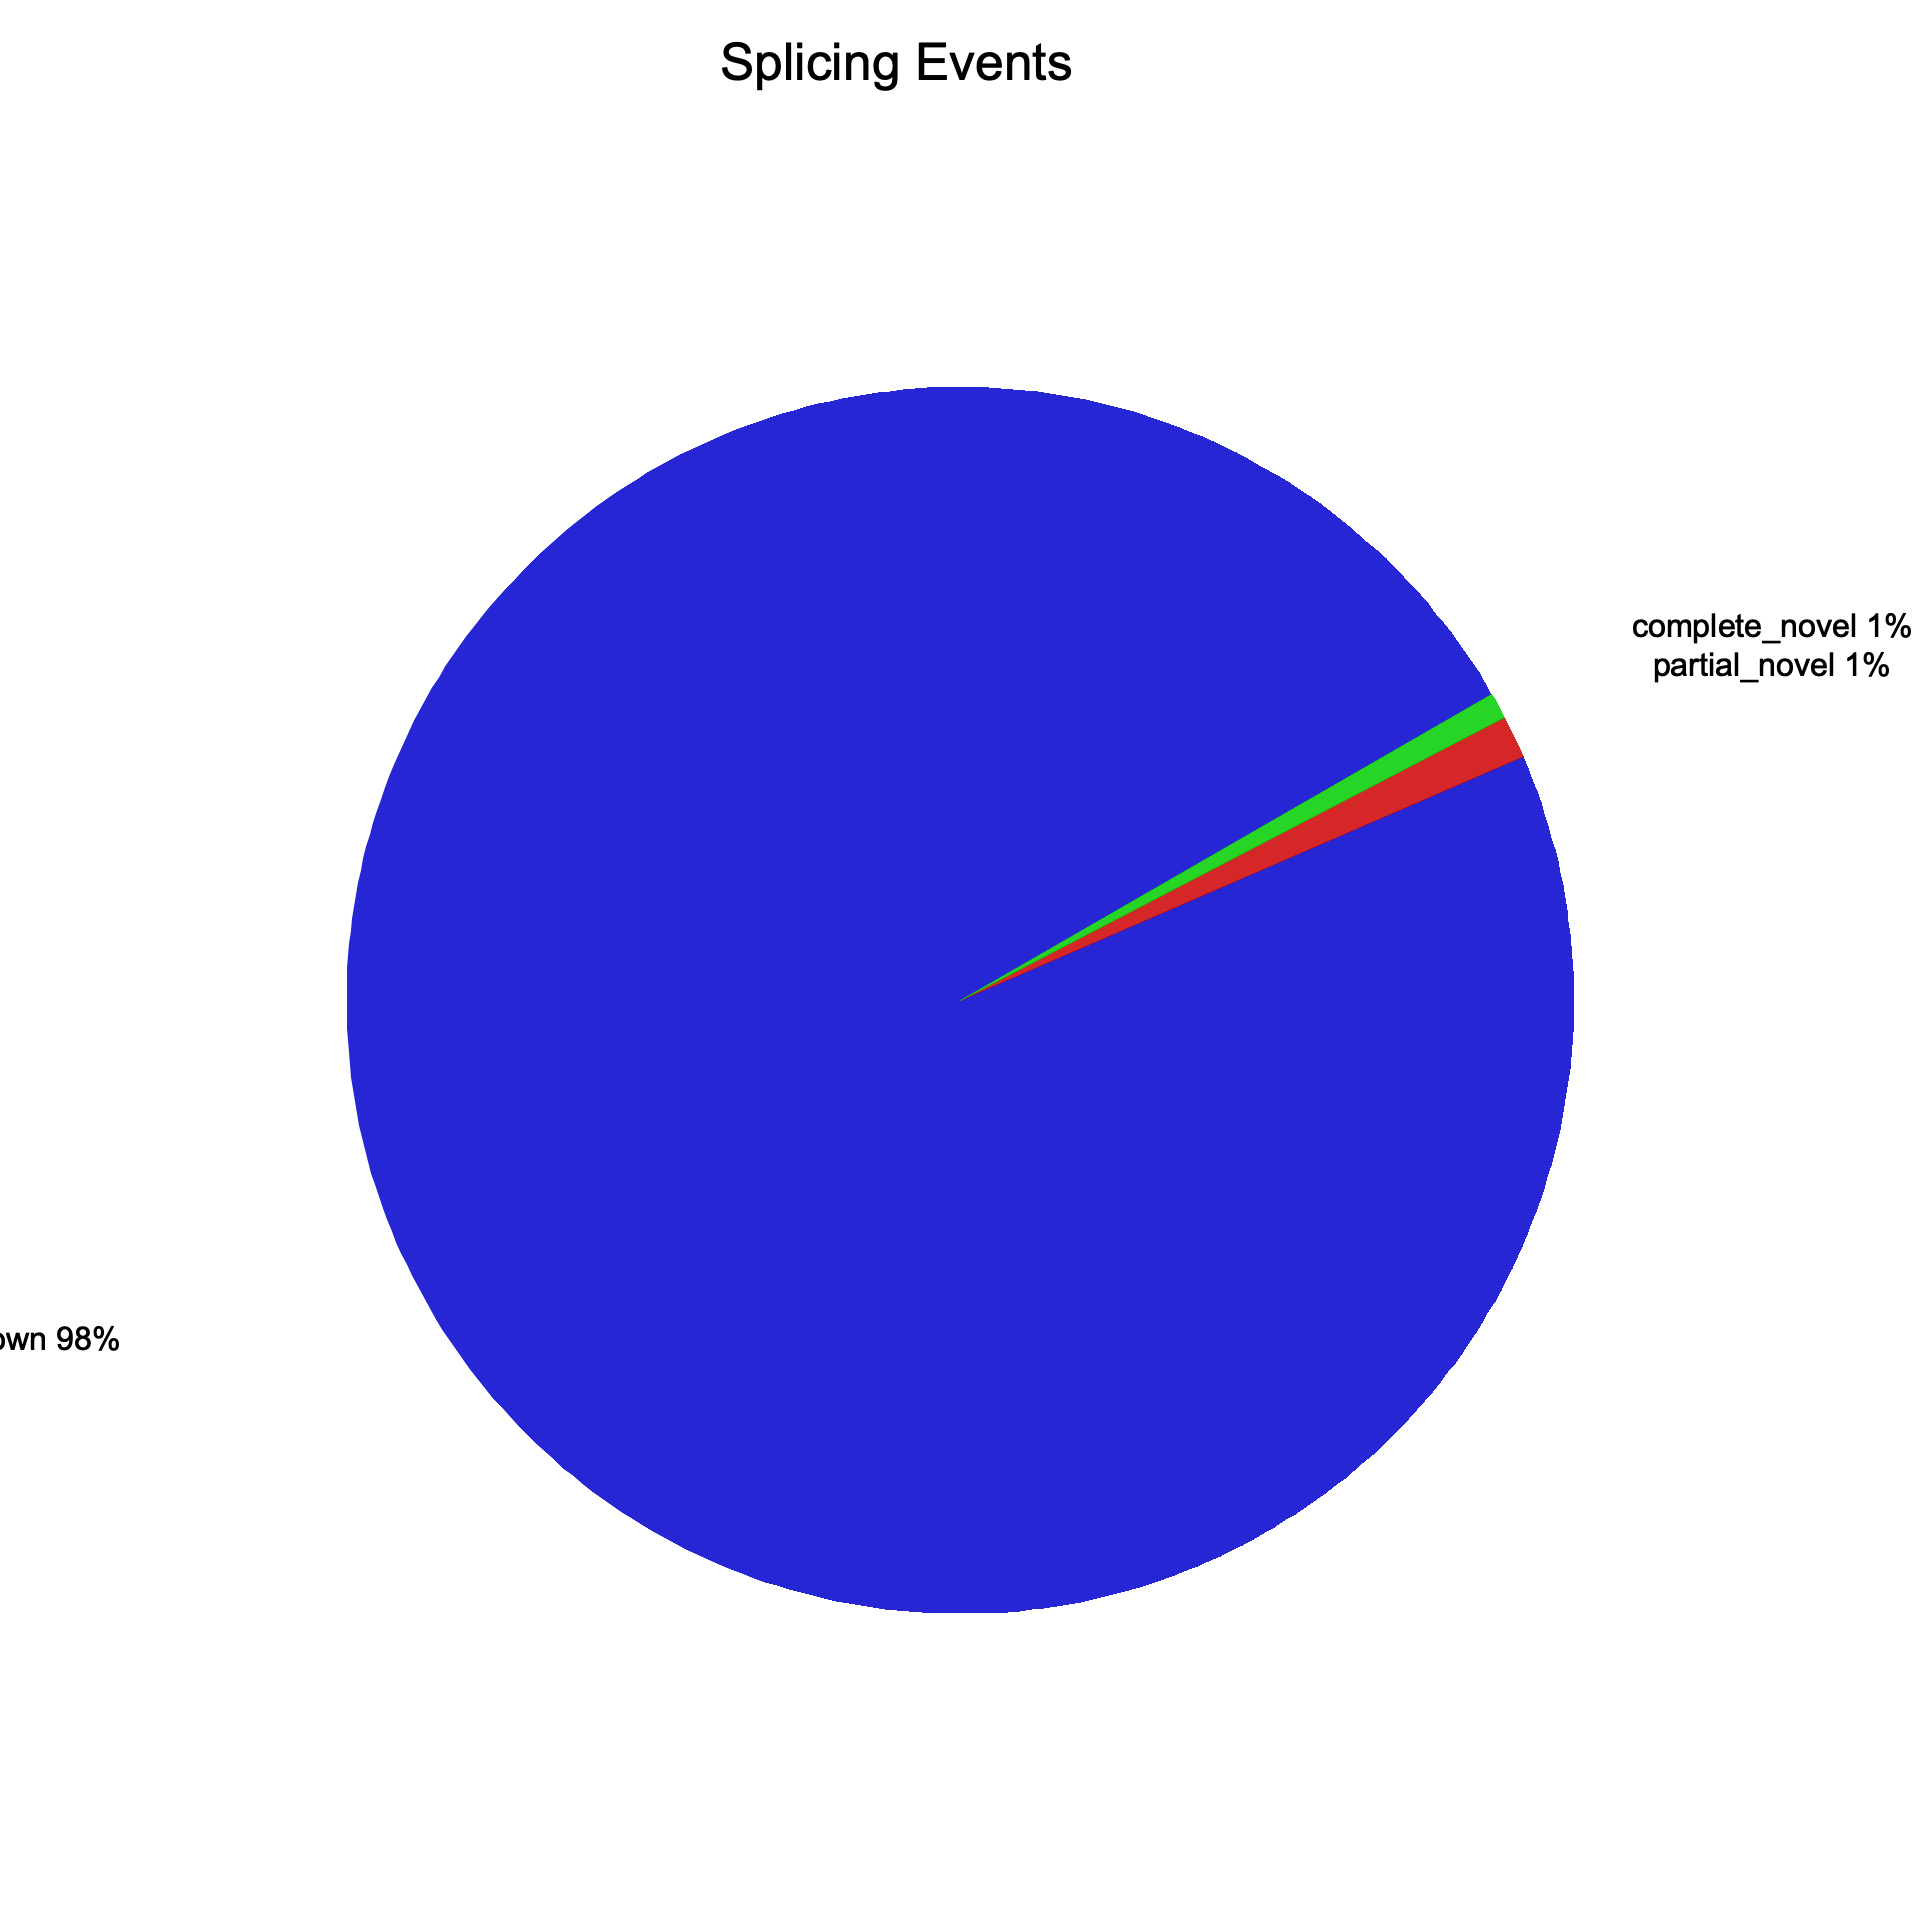
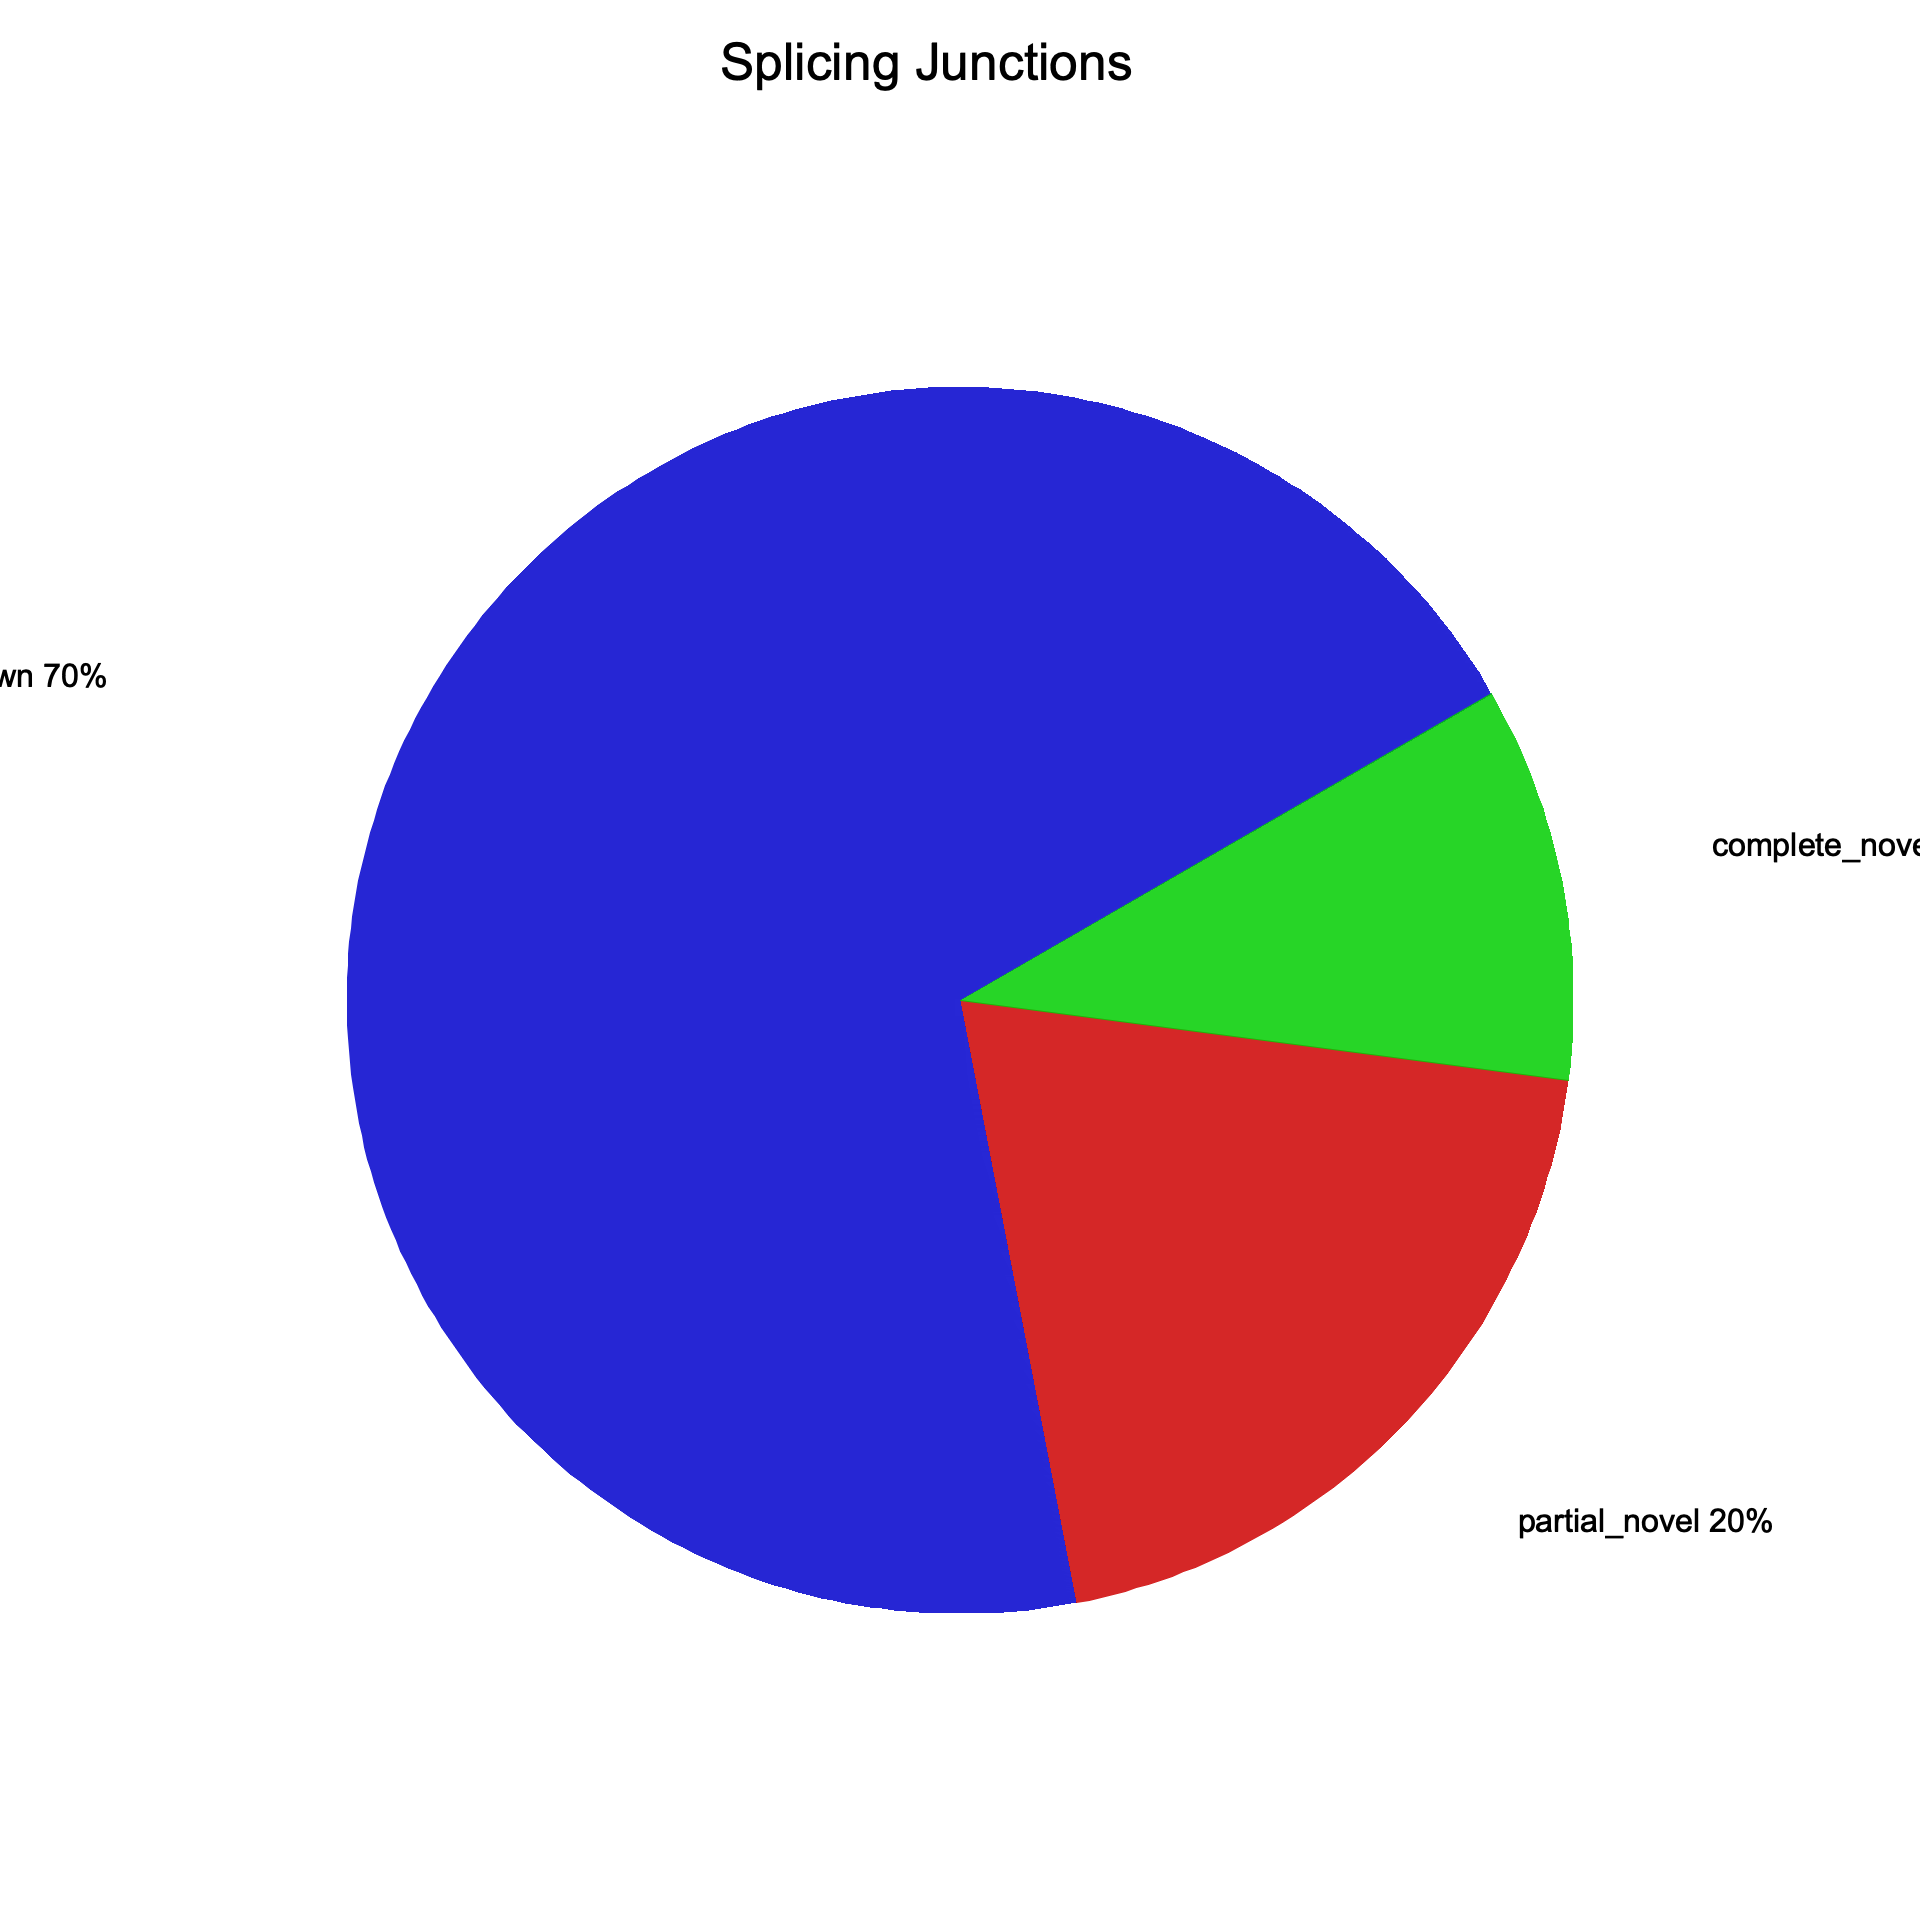
junction_annotation
Section titled “junction_annotation”Classifies observed splice junctions as known, partially novel, or completely novel by comparing against annotated transcript models.
All values are identical:
| Metric | RSeQC | RustQC |
|---|---|---|
| Splice events | ||
| Total events | 13,065,665 | 13,065,665 |
| Known | 12,805,967 | 12,805,967 |
| Partially novel | 146,659 | 146,659 |
| Novel | 91,614 | 91,614 |
| Splice junctions | ||
| Total junctions | 256,466 | 256,466 |
| Known | 178,797 | 178,797 |
| Partially novel | 50,936 | 50,936 |
| Novel | 26,733 | 26,733 |
Splice event plots
Section titled “Splice event plots”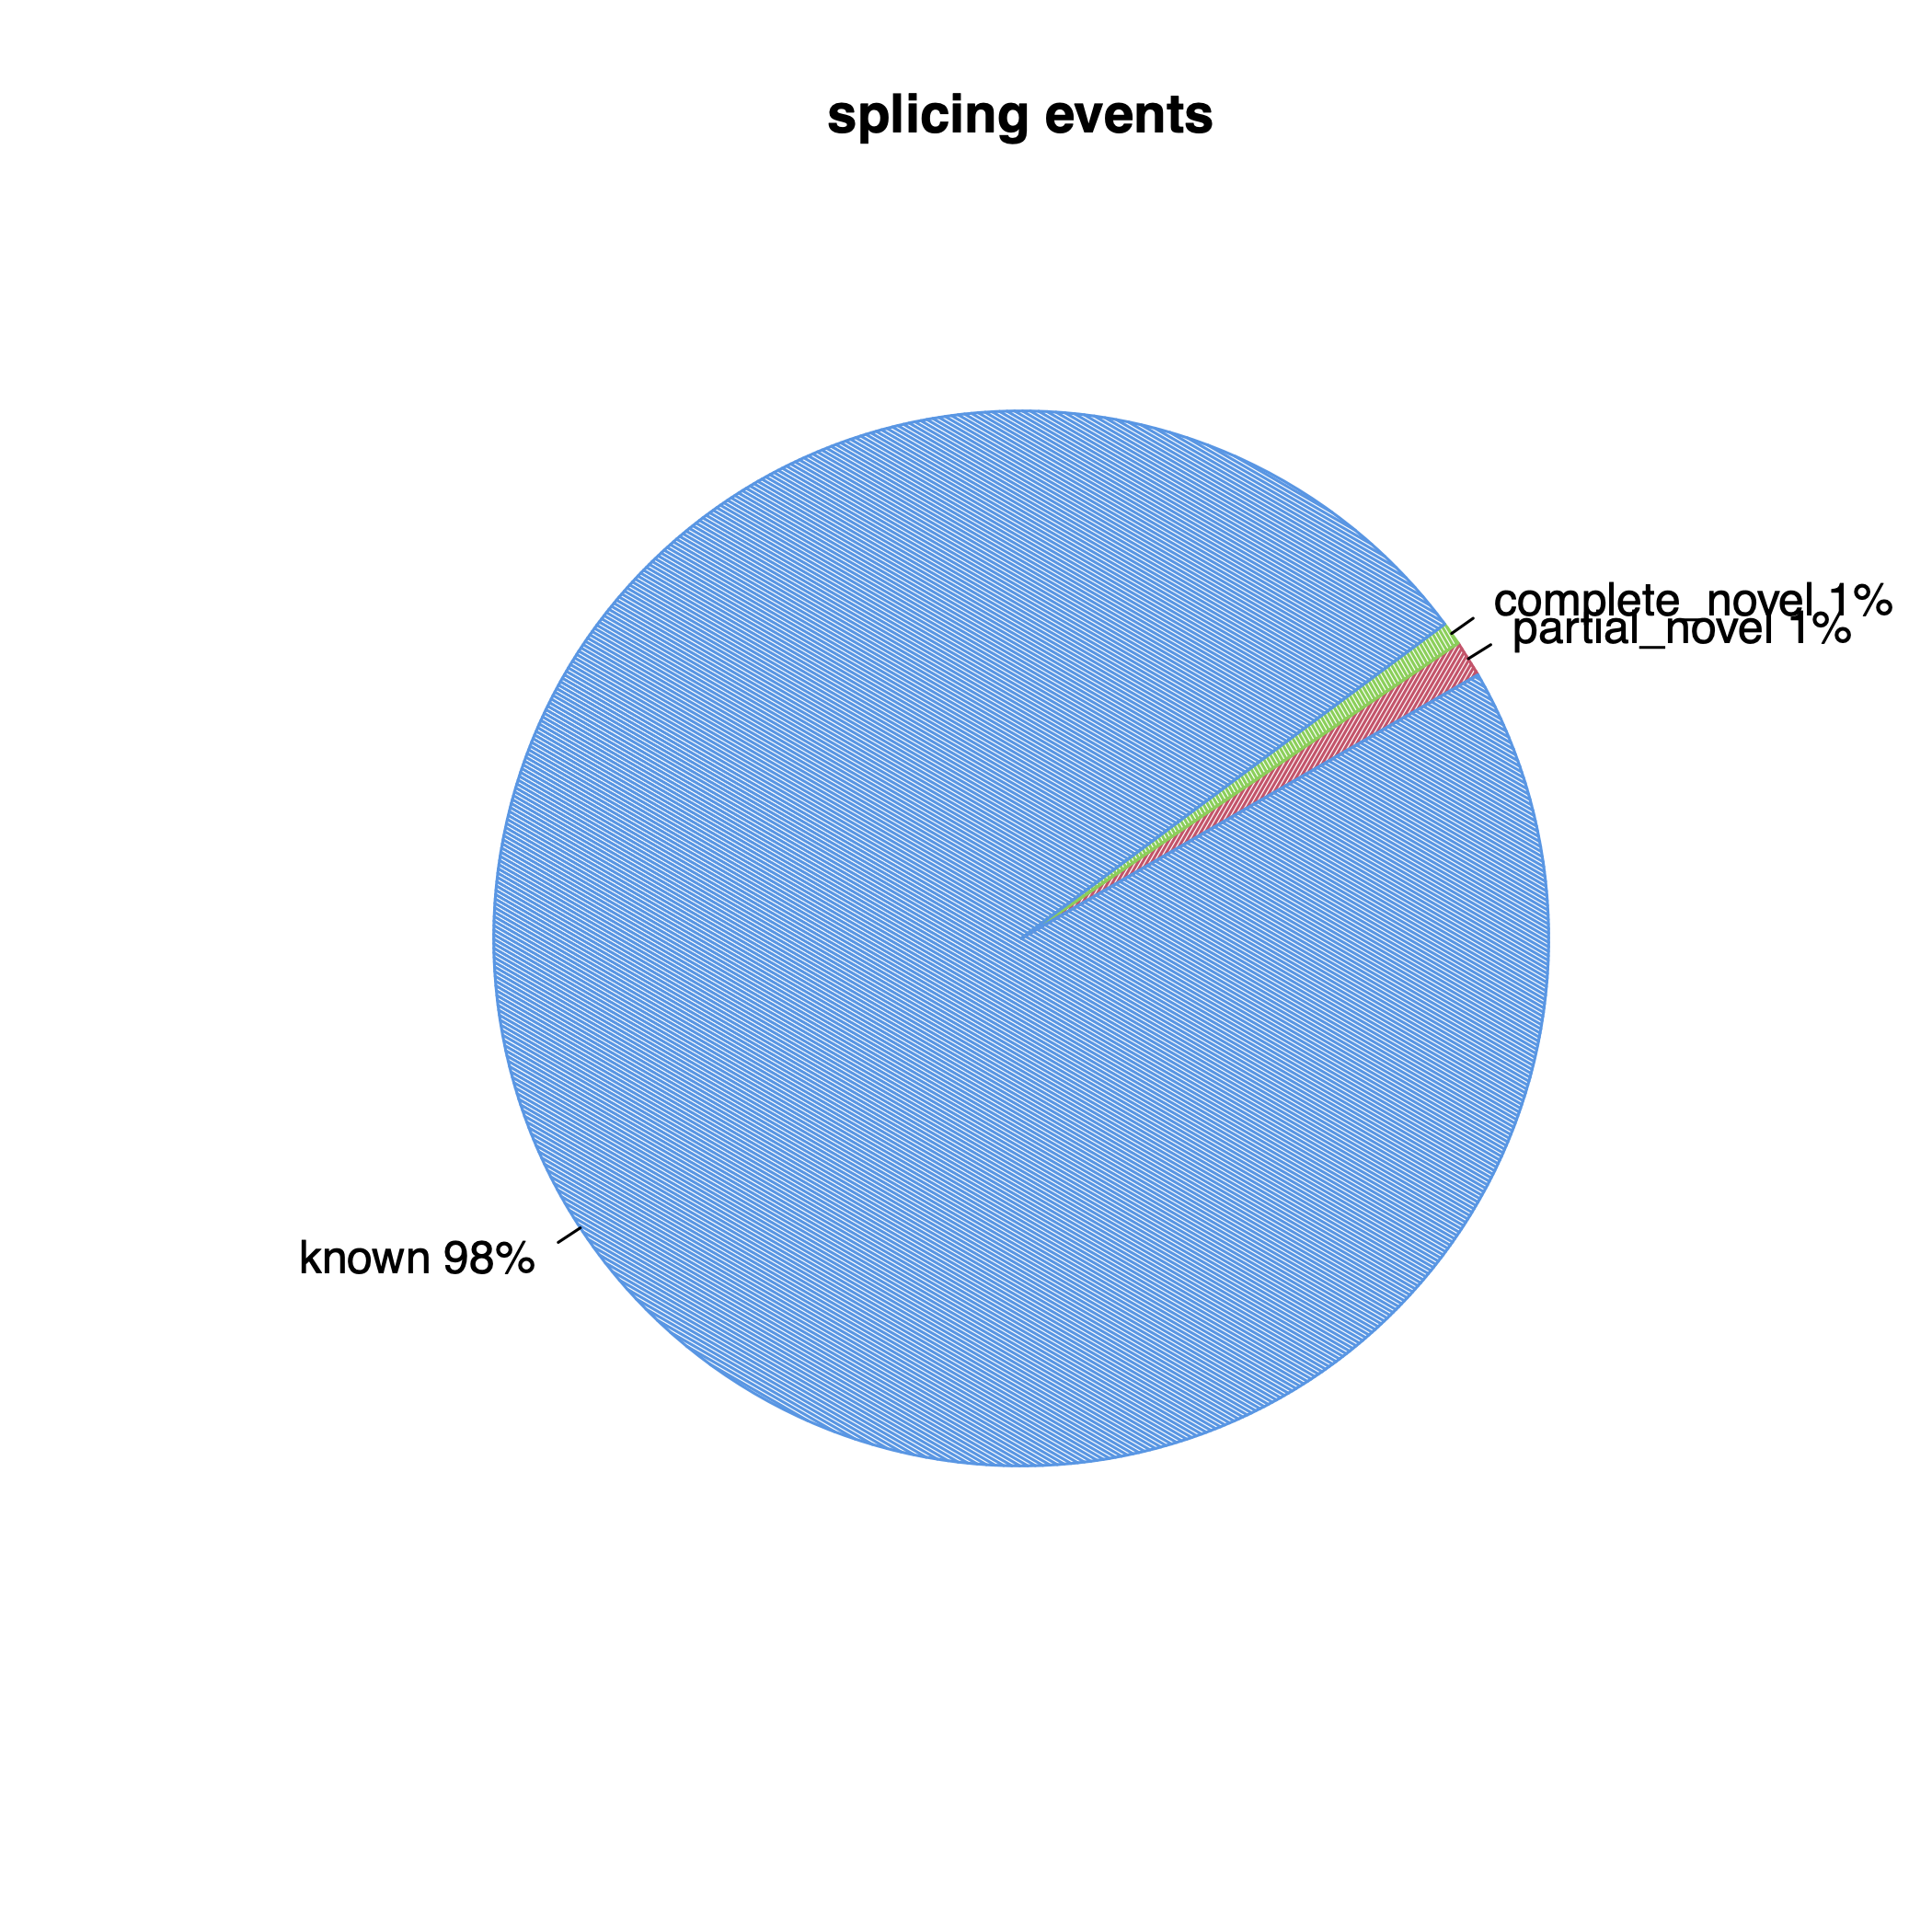
Splice junction plots
Section titled “Splice junction plots”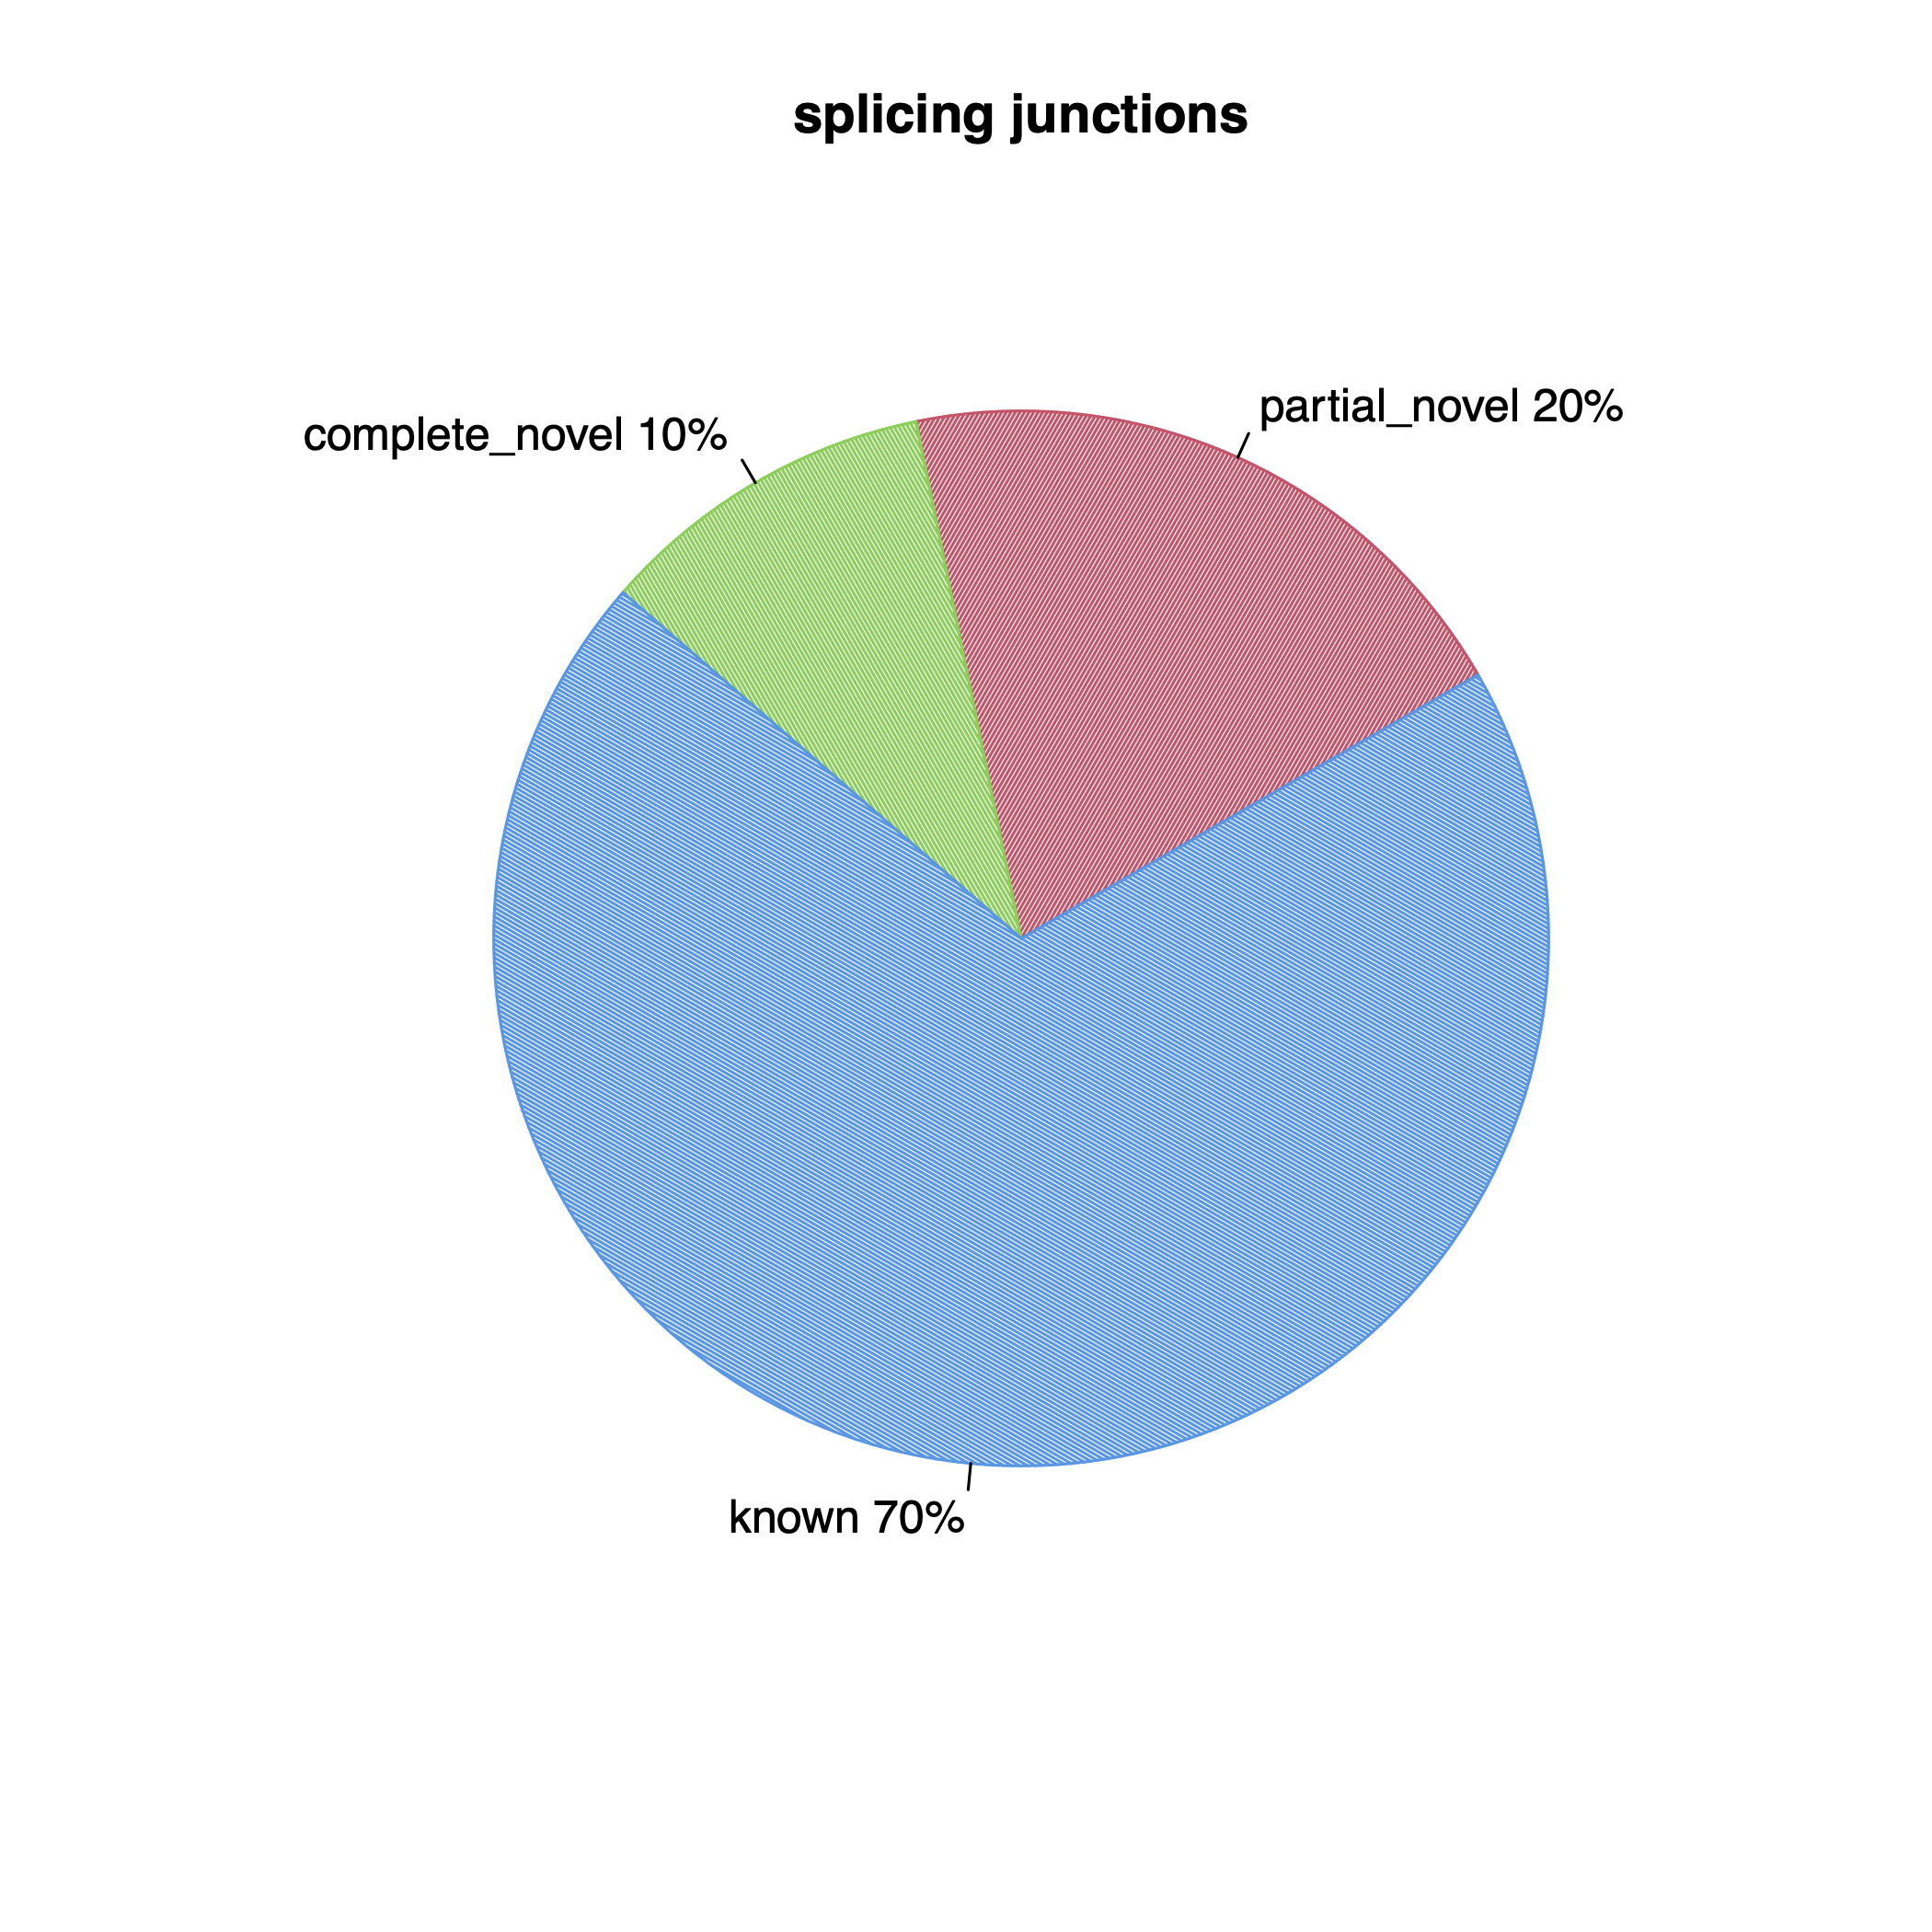
junction_saturation
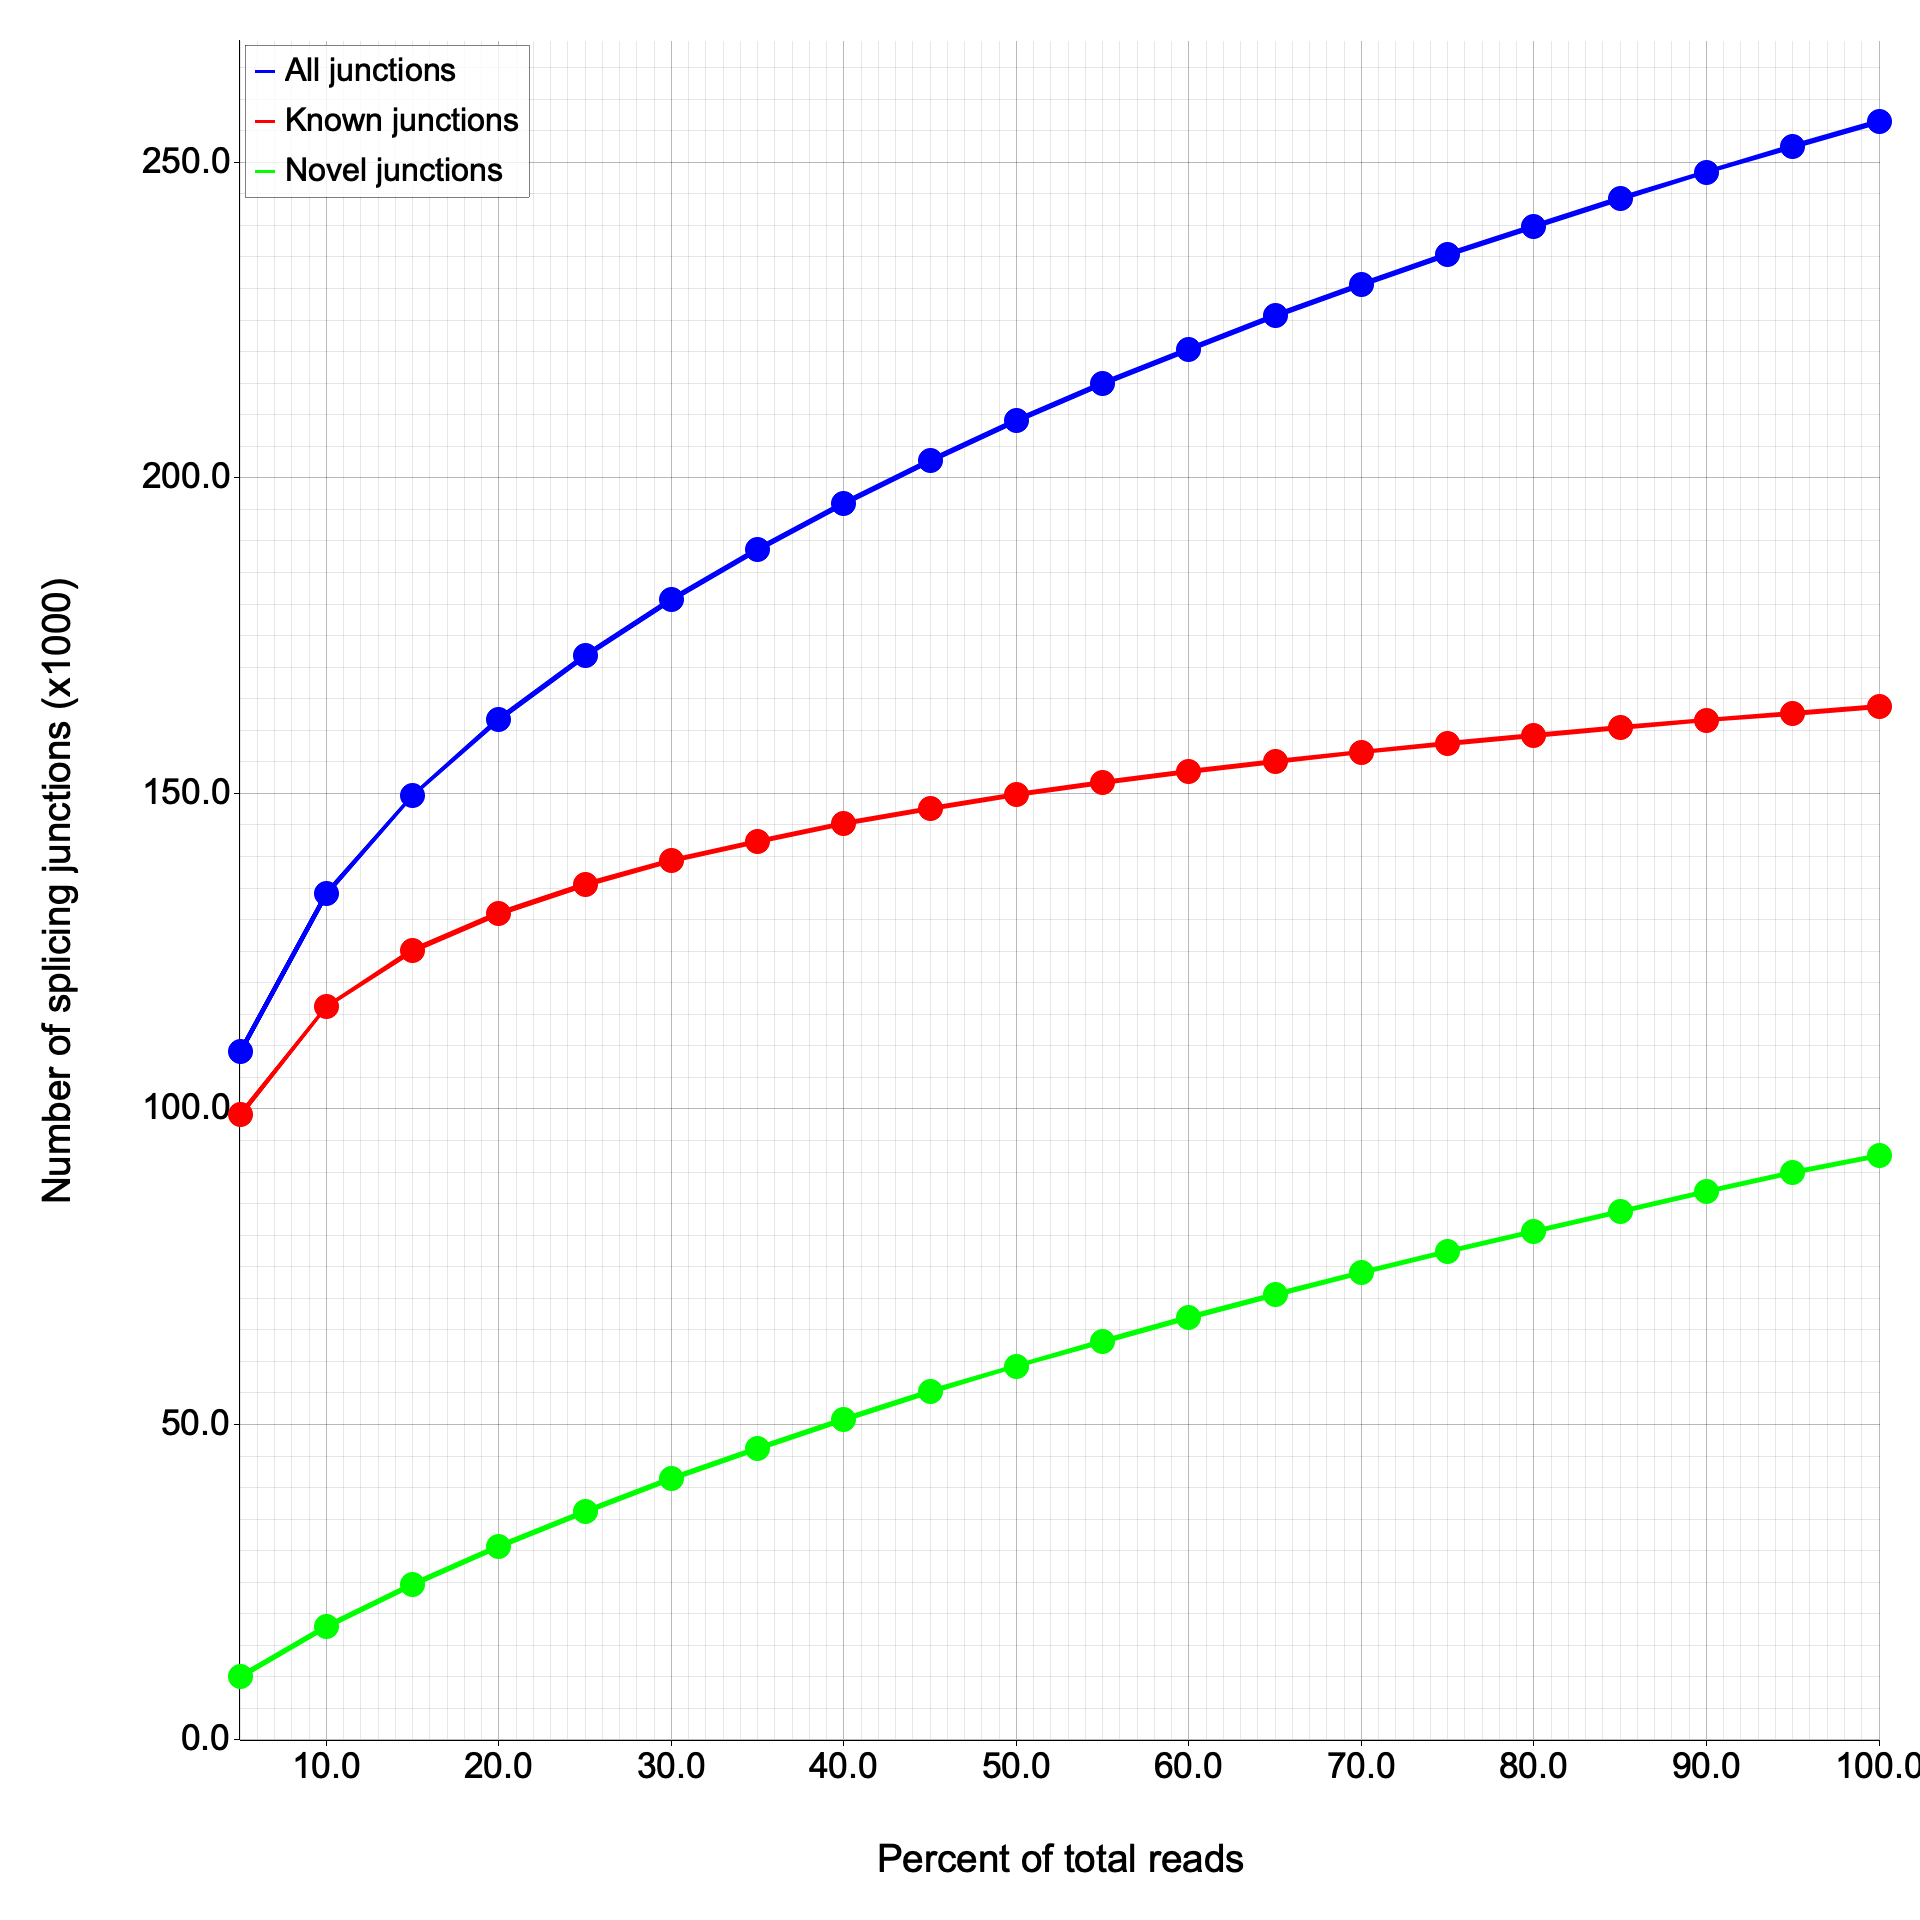
Section titled “junction_saturation”Evaluates whether sequencing depth is sufficient to detect all splice junctions by subsampling reads at increasing fractions.
At 100% sampling depth:
| Metric | RSeQC | RustQC |
|---|---|---|
| Total junctions | 256,466 | 256,392 |
| Known junctions | 163,710 | 163,710 |
| Novel junctions | 92,756 | 92,682 |
The known junction count matches exactly. The 74-junction difference in total/novel is due to random sampling order — junction_saturation uses randomized subsampling, and different shuffling produces slightly different totals at each sampling fraction.
Junction saturation plots
Section titled “Junction saturation plots”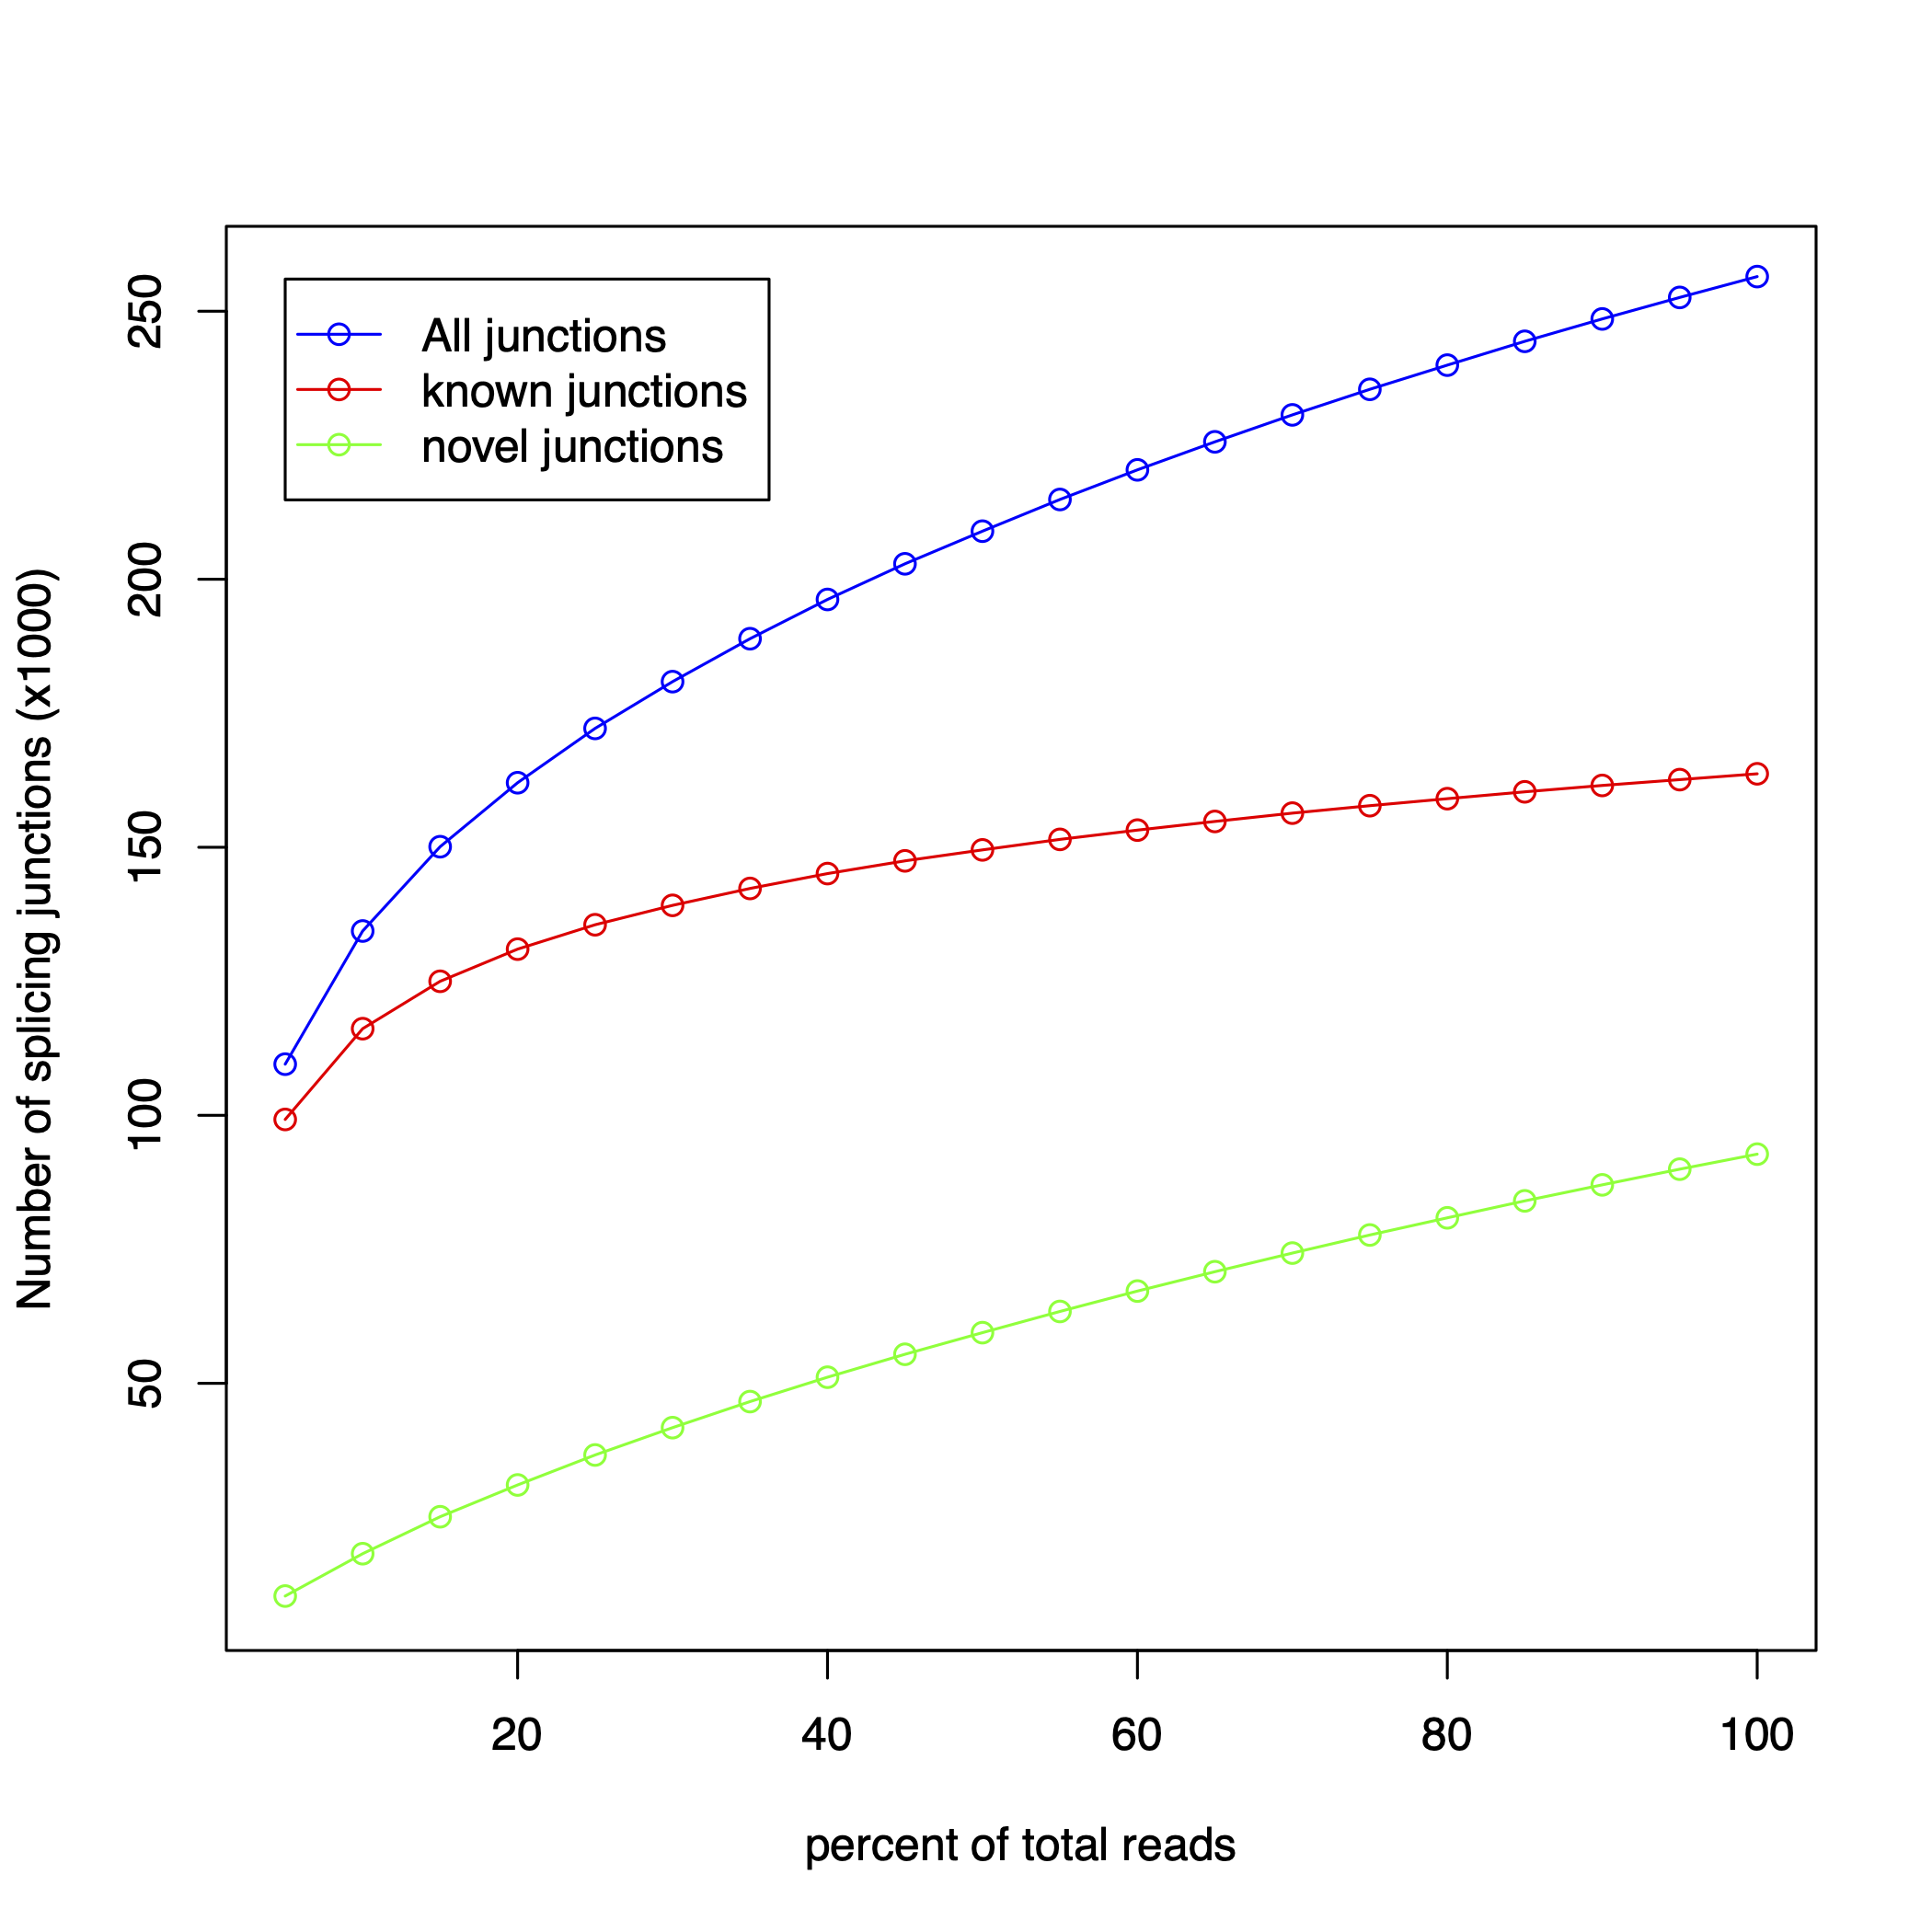
inner_distance
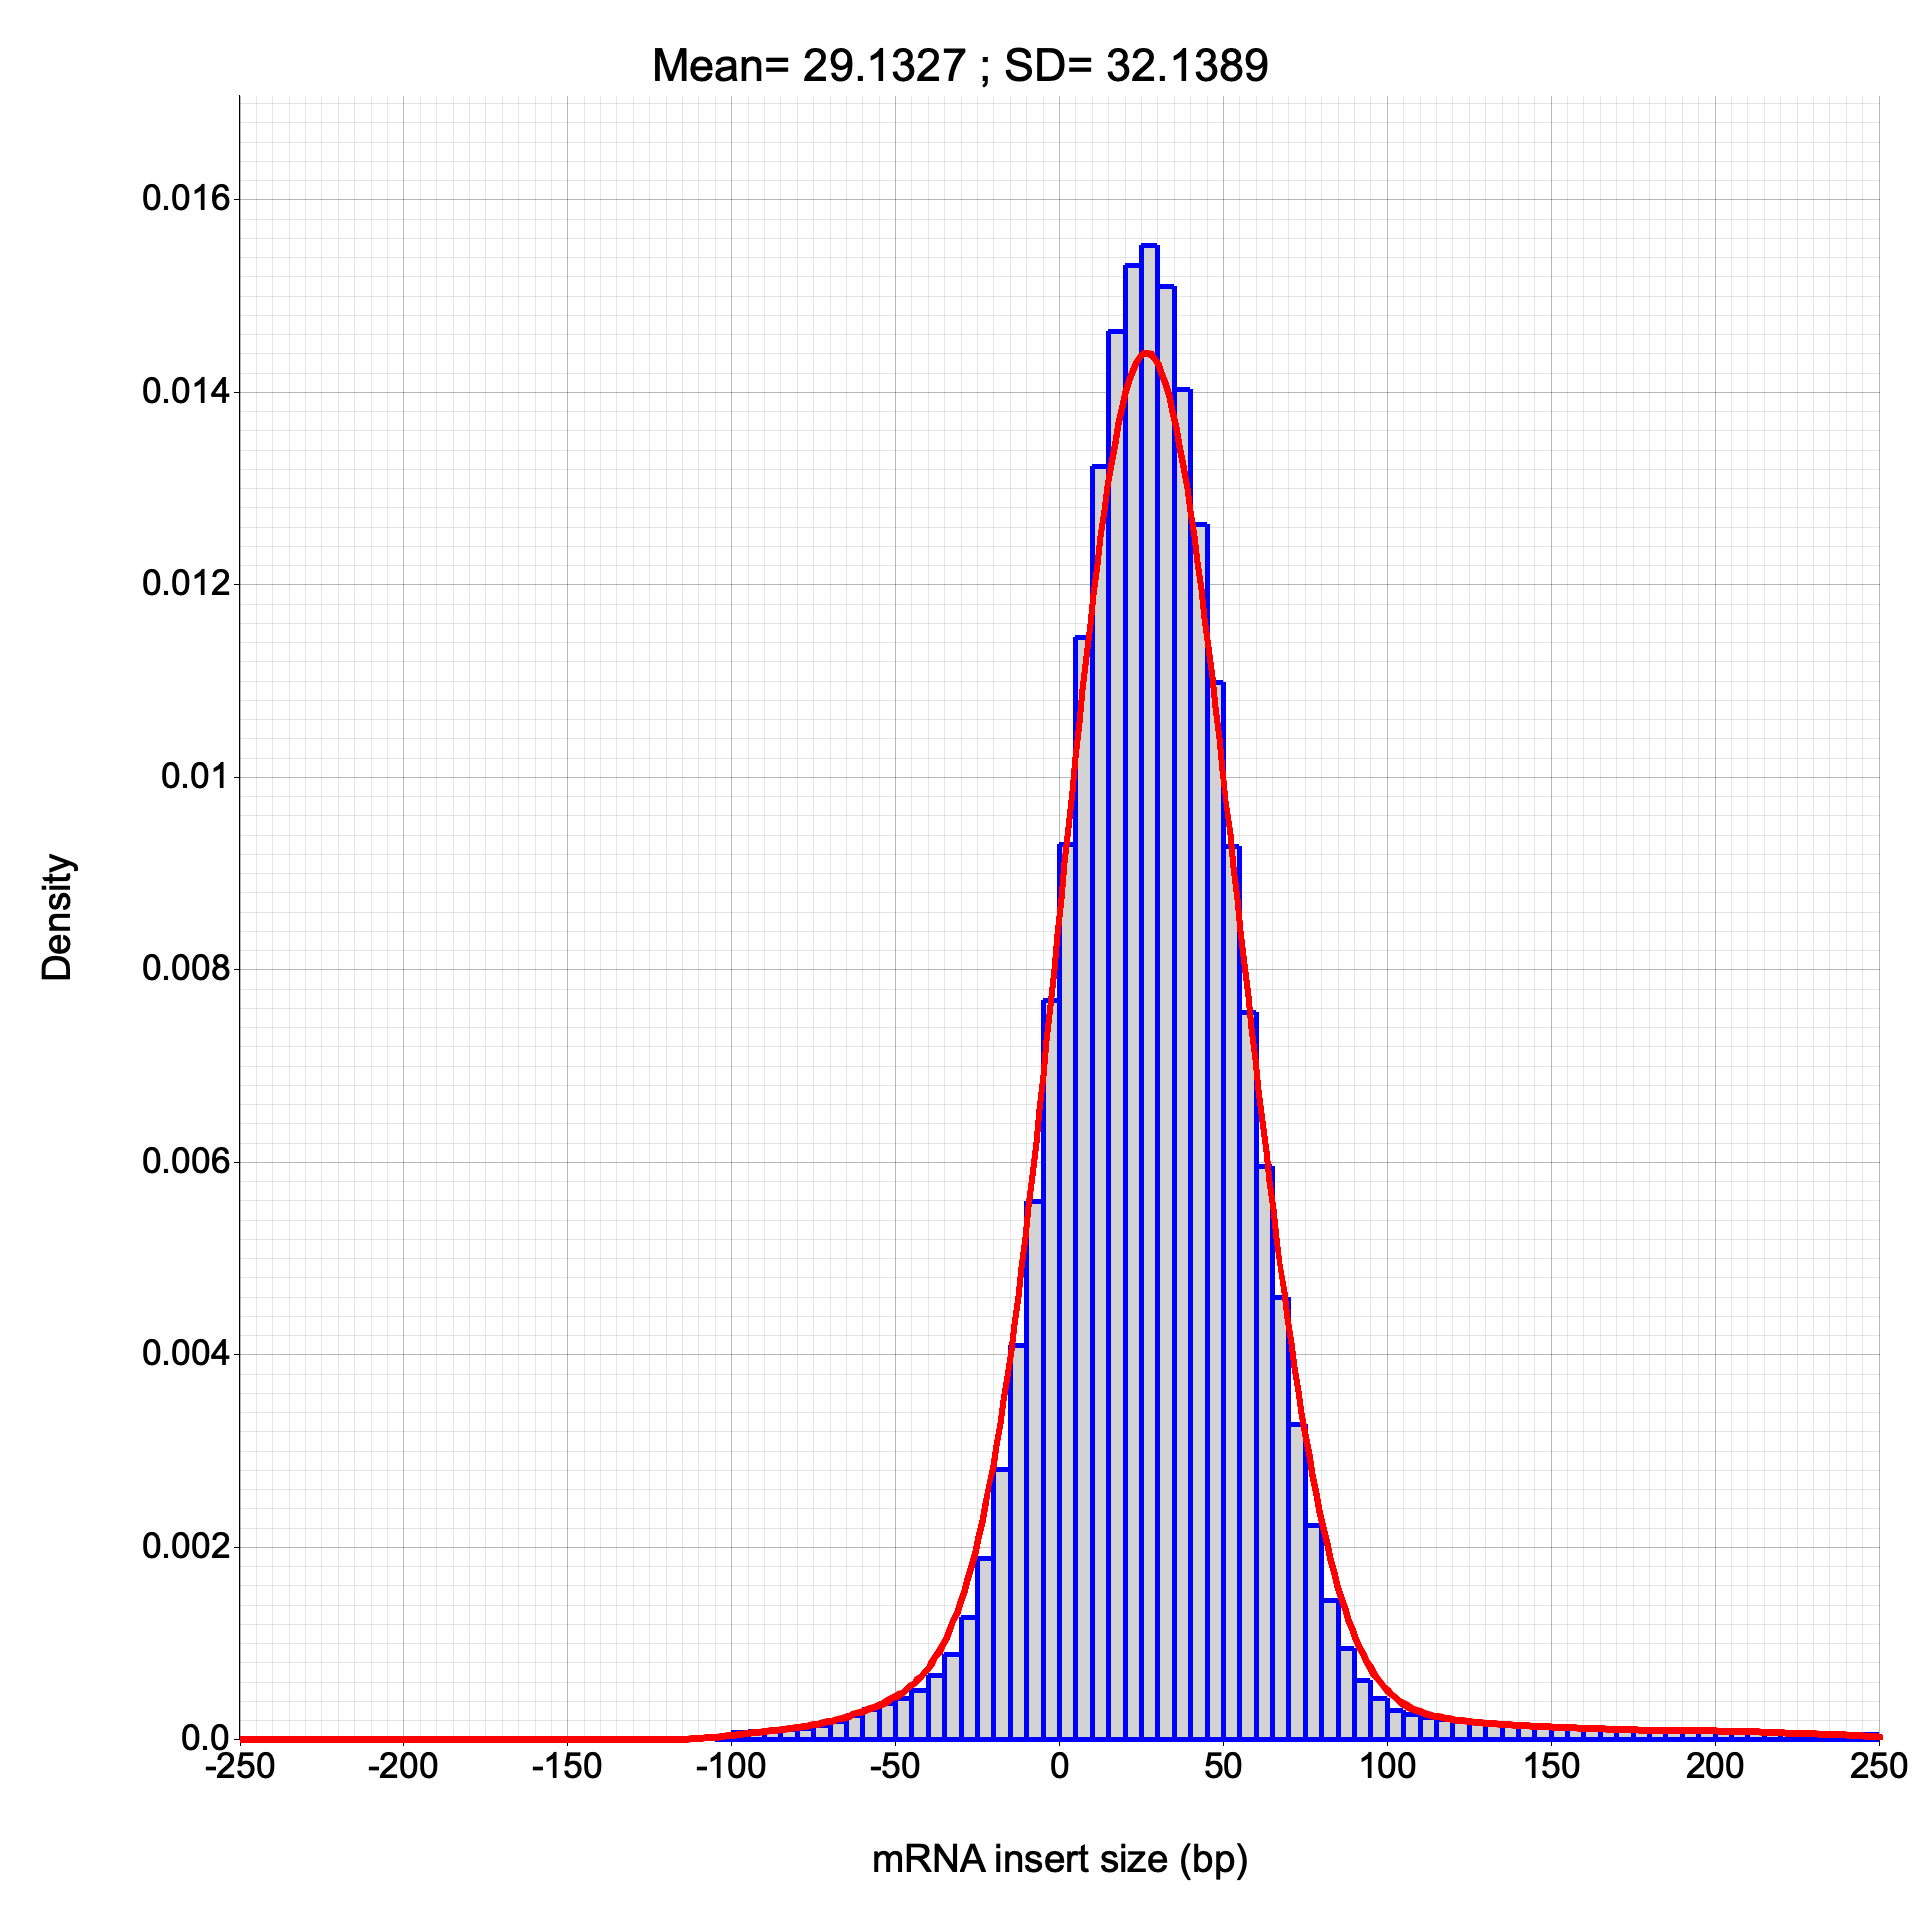
Section titled “inner_distance”Calculates the inner distance between paired-end reads for fragment size estimation, classifying pairs by transcript and exon membership.
Read classifications (sameTranscript, sameExon, overlap type) match between RSeQC and RustQC. Inner distance values show occasional ±1 bp differences due to minor CIGAR alignment length calculation differences. The overall frequency distribution is consistent between both tools.
Inner distance plots
Section titled “Inner distance plots”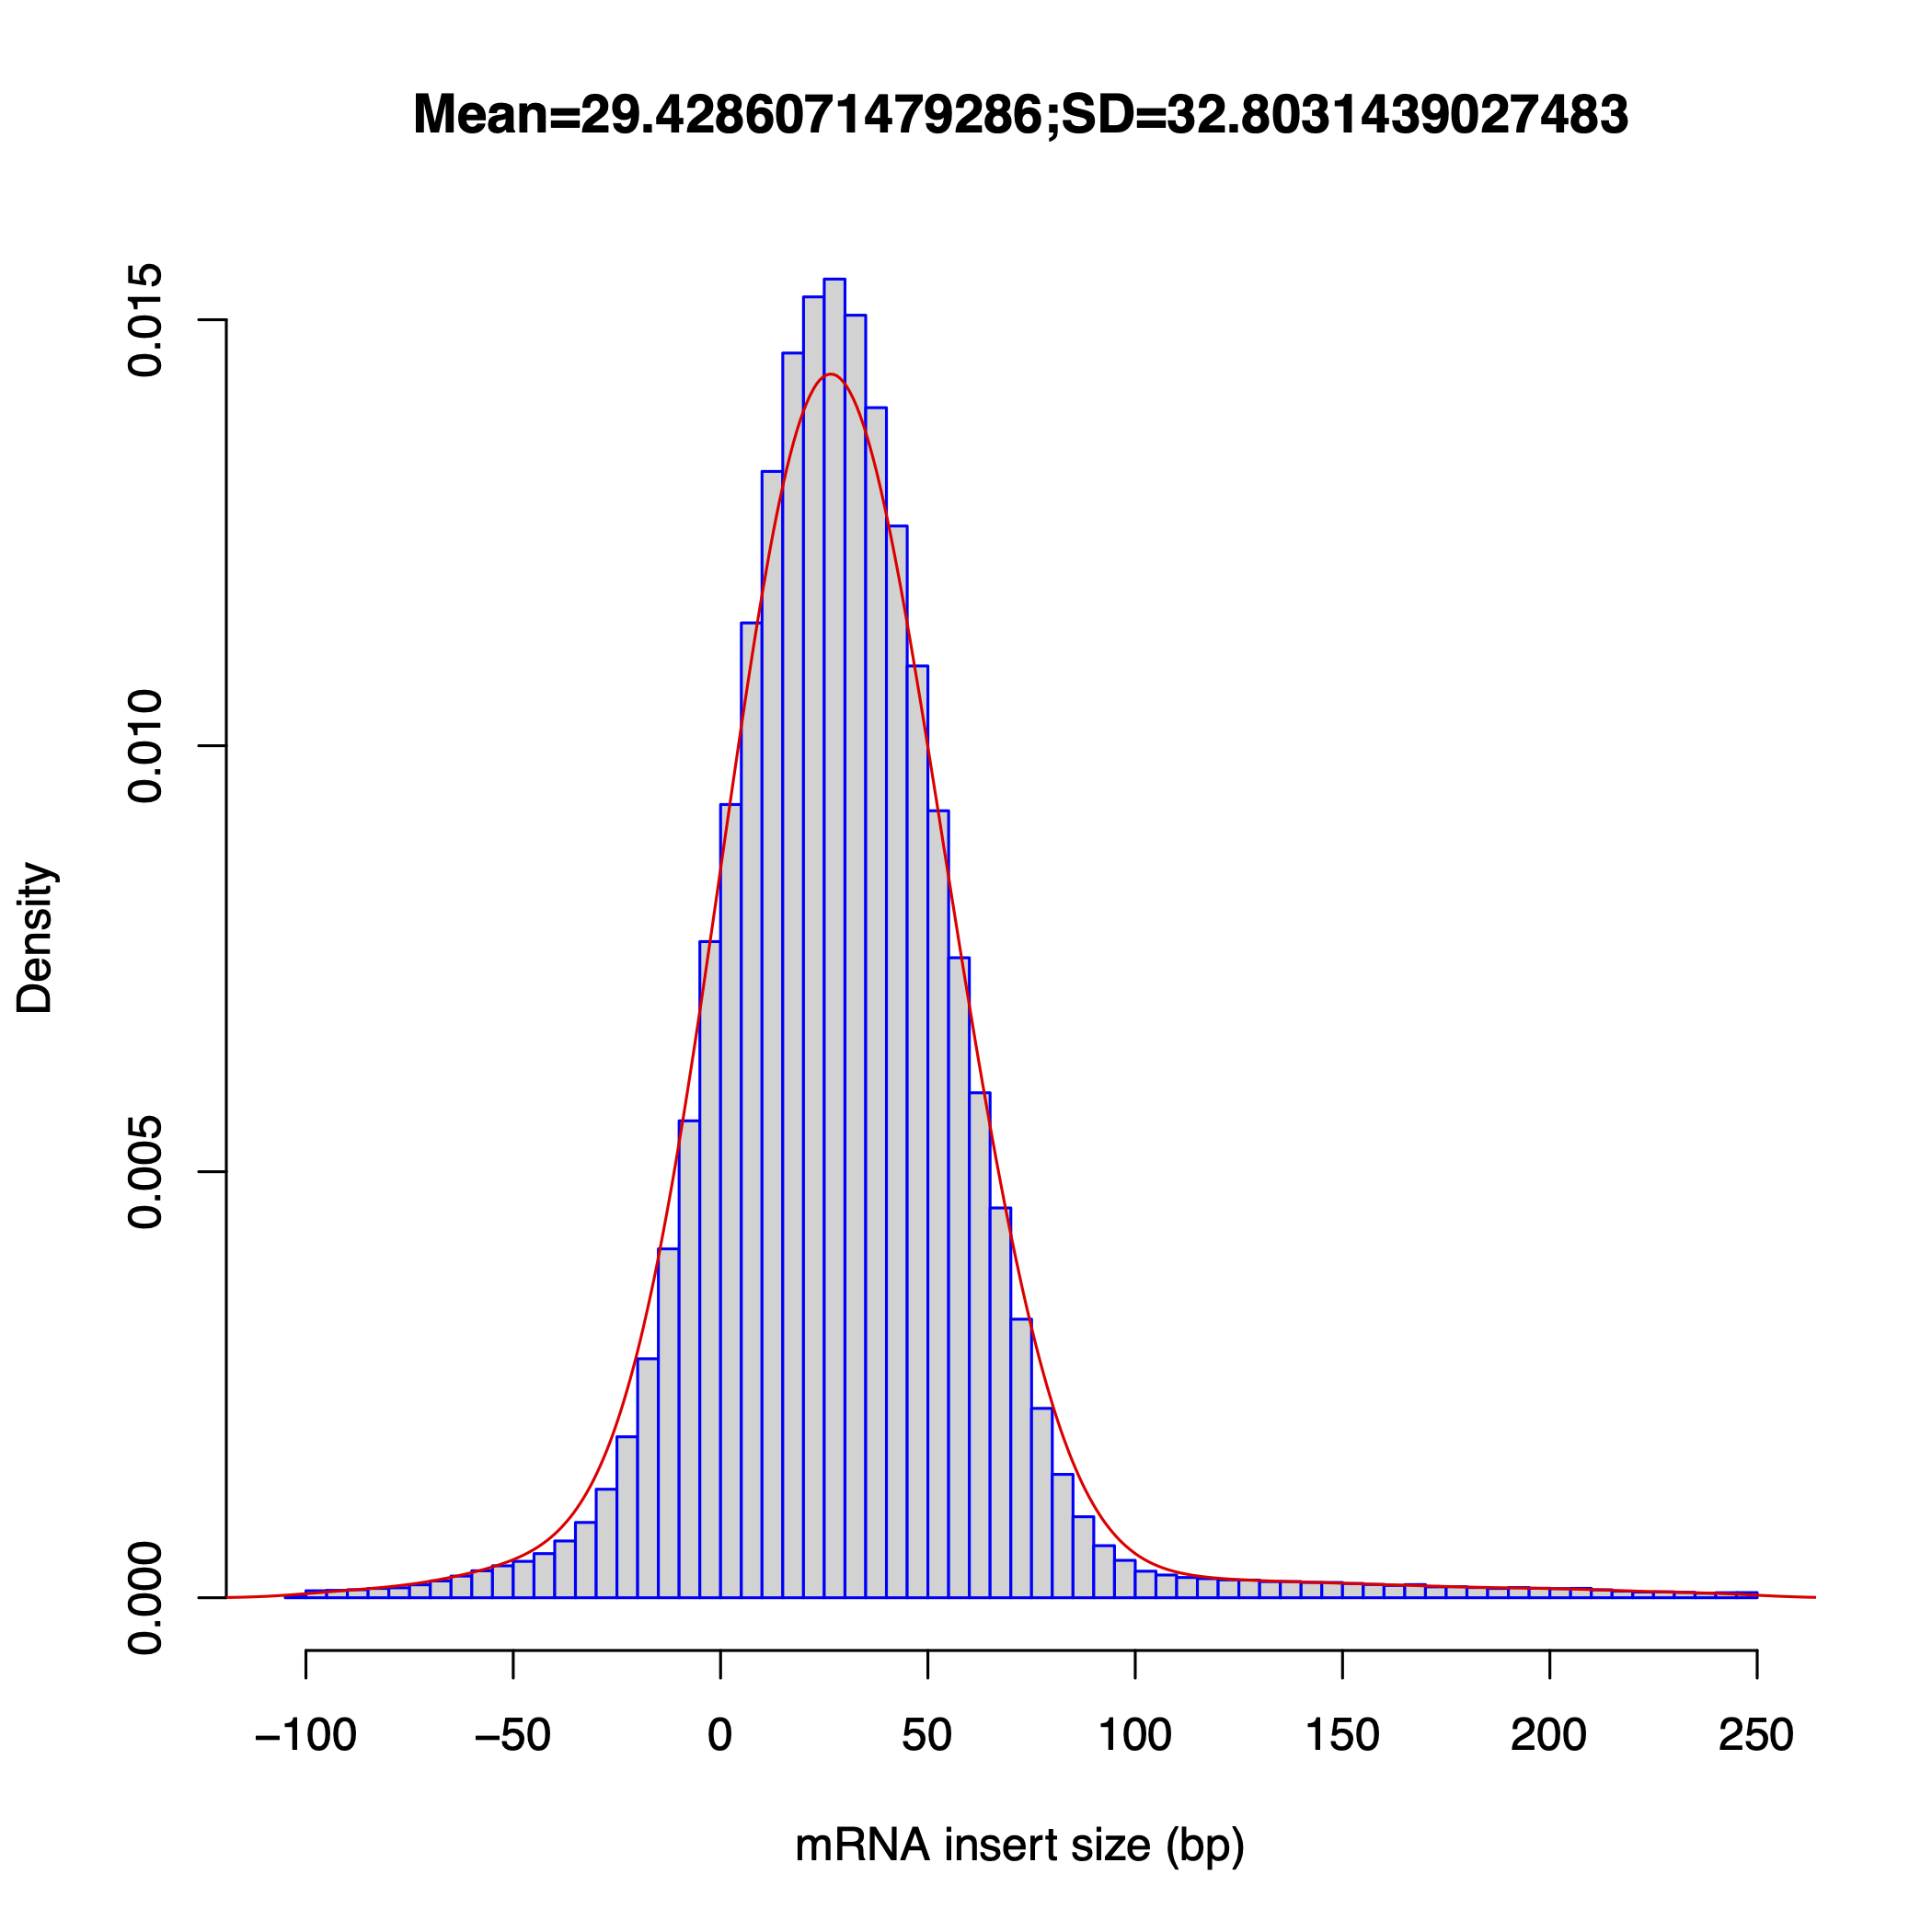
TIN (Transcript Integrity Number)
Section titled “TIN (Transcript Integrity Number)”RustQC reimplements RSeQC’s tin.py, producing per-gene TIN scores that measure
transcript integrity via Shannon entropy of read coverage uniformity.
Summary statistics
Section titled “Summary statistics”| Metric | RustQC |
|---|---|
| Genes analysed | 16,499 |
| TIN mean | 72.55 |
| TIN median | 83.89 |
| TIN stdev | 26.14 |
The TIN analysis completes as part of the single-pass BAM processing. The
original RSeQC tin.py requires a separate full BAM pass and typically takes
45+ minutes for a 10 GB file.
Output format
Section titled “Output format”RustQC produces gene-level TIN scores (one row per gene, using the longest
transcript as representative), while RSeQC’s tin.py produces transcript-level
scores. Both formats are compatible with MultiQC. The gene-level approach
provides a cleaner summary with one score per gene.
Gene body coverage (Qualimap)
Section titled “Gene body coverage (Qualimap)”RustQC produces Qualimap-compatible gene body coverage output, including:
- A 100-bin coverage profile along normalized gene body positions (5’ to 3’)
- A Qualimap
rnaseq_qc_results.txtfile parseable by MultiQC
Coverage bias metrics
Section titled “Coverage bias metrics”| Metric | Value |
|---|---|
| 5’ bias | 1.20 |
| 3’ bias | 0.92 |
| 5’-3’ bias | 1.24 |
These metrics help identify degradation patterns — a 5’-3’ bias significantly above 1.0 may indicate RNA degradation, while values near 1.0 indicate uniform coverage.
Benchmark conditions
Section titled “Benchmark conditions”- BAM file: GM12878 ENCODE RNA-Seq, paired-end, ~185M reads, 10 GB
- Annotation: Ensembl BED12 gene model (same file used by both RSeQC and RustQC); Ensembl GTF used for TIN and gene body coverage (require gene-level annotation)
- RSeQC version: 5.0.4 (run via Docker on Apple M3 Max with Rosetta x86 emulation)
- RustQC: 10 threads,
--gtfmode for TIN/genebody,--bedmode for RSeQC tools - Hardware: Apple M3 Max, 128 GB RAM