dupRadar Benchmark
RustQC produces output identical to the R dupRadar package. Every value in the duplication matrix, every count, and the fitted model parameters match exactly. The benchmarks below quantify the performance difference on real RNA-seq data.
Small benchmark
Section titled “Small benchmark”Input: A test BAM file with a chr6-only GTF annotation (2,905 genes).
| Metric | dupRadar (R) | RustQC |
|---|---|---|
| Runtime | 2.50s | 0.25s |
| Speedup | — | 10x |
Results comparison (small)
Section titled “Results comparison (small)”| Metric | dupRadar (R) | RustQC | Exact match |
|---|---|---|---|
| Intercept | 0.03186 | 0.03186 | Yes |
| Slope | 1.60189 | 1.60189 | Yes |
| Genes total | 2,905 | 2,905 | Yes |
| Genes with reads | 636 | 636 | Yes |
| Genes with duplicates | 201 | 201 | Yes |
| allCounts (unique) | 20,449 | 20,449 | 100% |
| filteredCounts (unique) | 17,879 | 17,879 | 100% |
| allCountsMulti | 22,812 | 22,812 | 100% |
| filteredCountsMulti | 20,034 | 20,034 | 100% |
| Total values compared | 37,765 | 37,765 | — |
| Value mismatches | — | 0 | — |
Large benchmark
Section titled “Large benchmark”Input: GM12878 REP1 — a full-size RNA-seq BAM (~10 GB) from the nf-core/rnaseq pipeline, duplicate-marked with Picard. Paired-end, unstranded, aligned to GRCh38 (63,086 genes).
Performance
Section titled “Performance”| Tool | Runtime | Max RSS |
|---|---|---|
| R dupRadar | 27m 21s | N/A (Docker) |
| RustQC (10 threads) | 3m 56s | 6.1 GB |
Note: RustQC now runs dupRadar, featureCounts, and all 7 RSeQC tools in a single pass, so its runtime reflects the full combined workload. R dupRadar timings are from Docker with x86 emulation on ARM Mac.
Results comparison (large)
Section titled “Results comparison (large)”| Metric | dupRadar (R) | RustQC | Exact match |
|---|---|---|---|
| Intercept | 0.8245 | 0.8245 | Yes |
| Slope | 1.6774 | 1.6774 | Yes |
| Genes total | 63,086 | 63,086 | Yes |
| Genes with reads (unique) | 23,597 | 23,597 | Yes |
| Genes with reads (multi) | 24,719 | 24,719 | Yes |
| allCounts (unique) | 14,654,579 | 14,654,579 | 100% |
| filteredCounts (unique) | 3,599,832 | 3,599,832 | 100% |
| allCountsMulti | 16,089,488 | 16,089,488 | 100% |
| filteredCountsMulti | 4,503,920 | 4,503,920 | 100% |
| Total values compared | 820,118 | 820,118 | — |
| Value mismatches | — | 0 | — |
All four count columns match exactly across all 63,086 genes for both unique and multi-mapper counts. A cell-by-cell comparison of the full duplication matrix (820,118 values) shows zero mismatches at a relative tolerance of 1e-6. Model fit parameters (intercept and slope) match to at least 10 significant digits.
Side-by-side plots
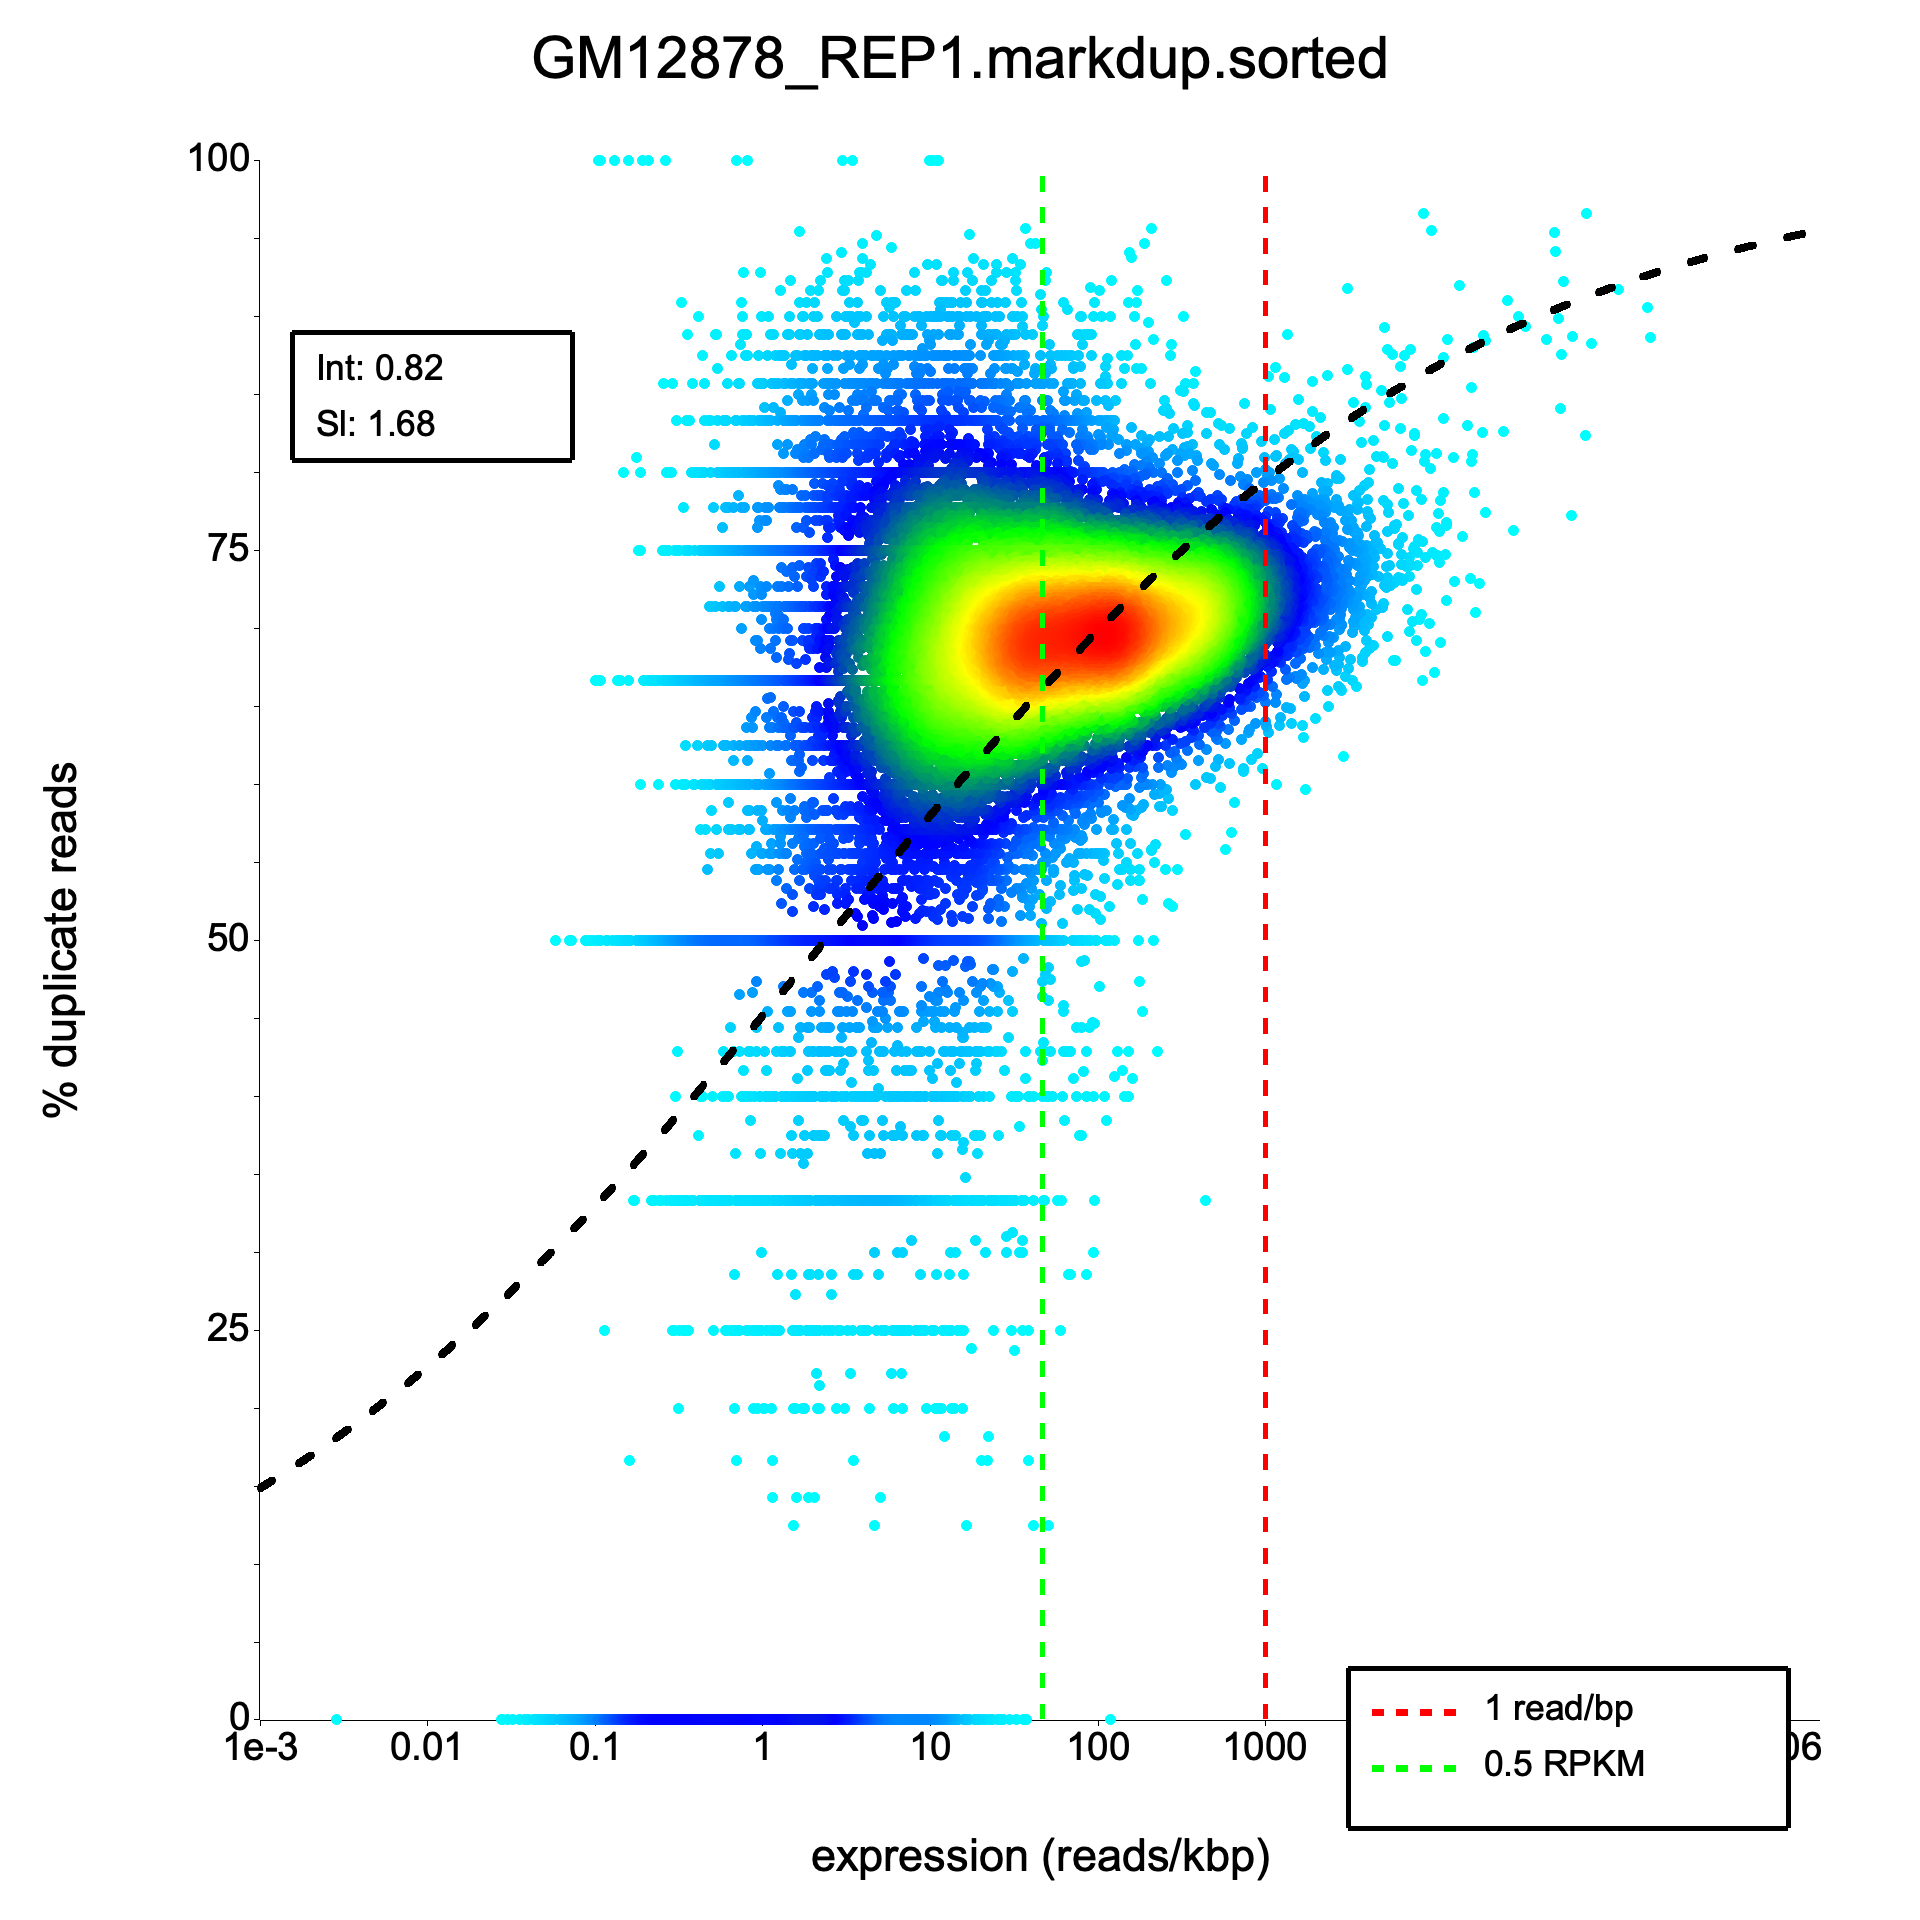
Section titled “Side-by-side plots”The plots below compare the R dupRadar output (left) with RustQC output (right) for the large benchmark.
Density scatter plot
Section titled “Density scatter plot”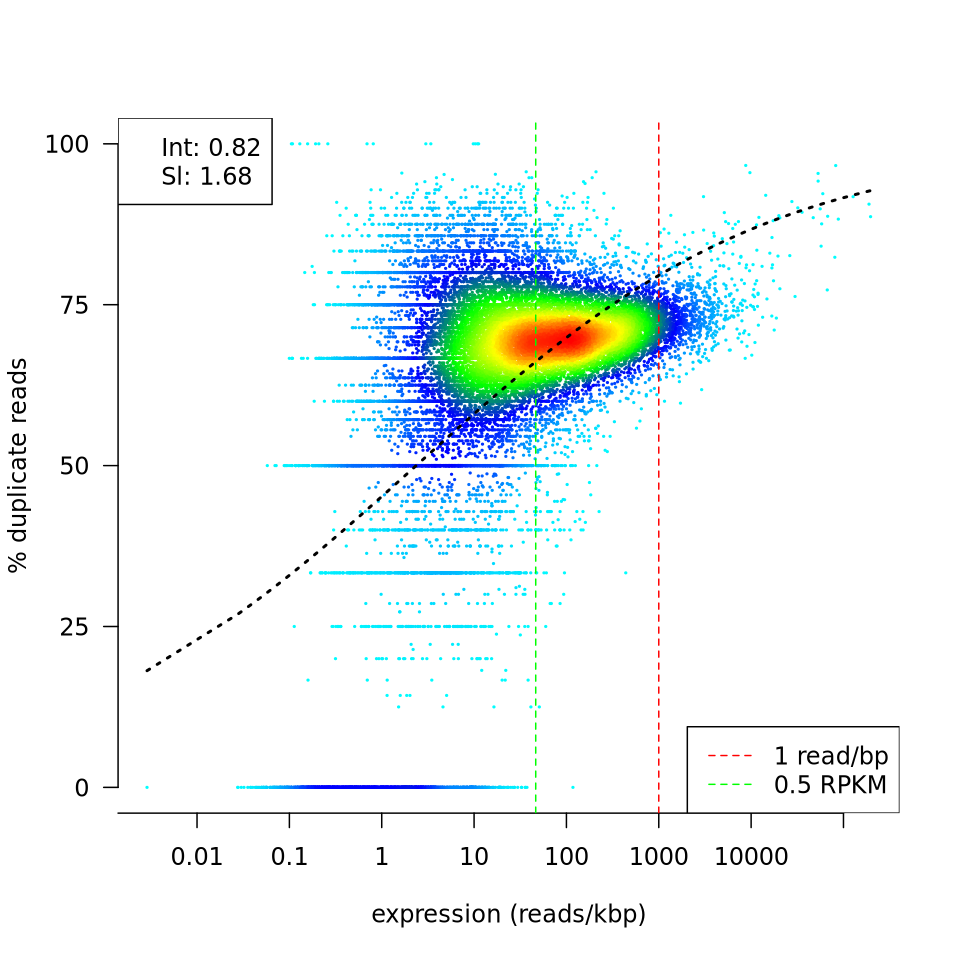
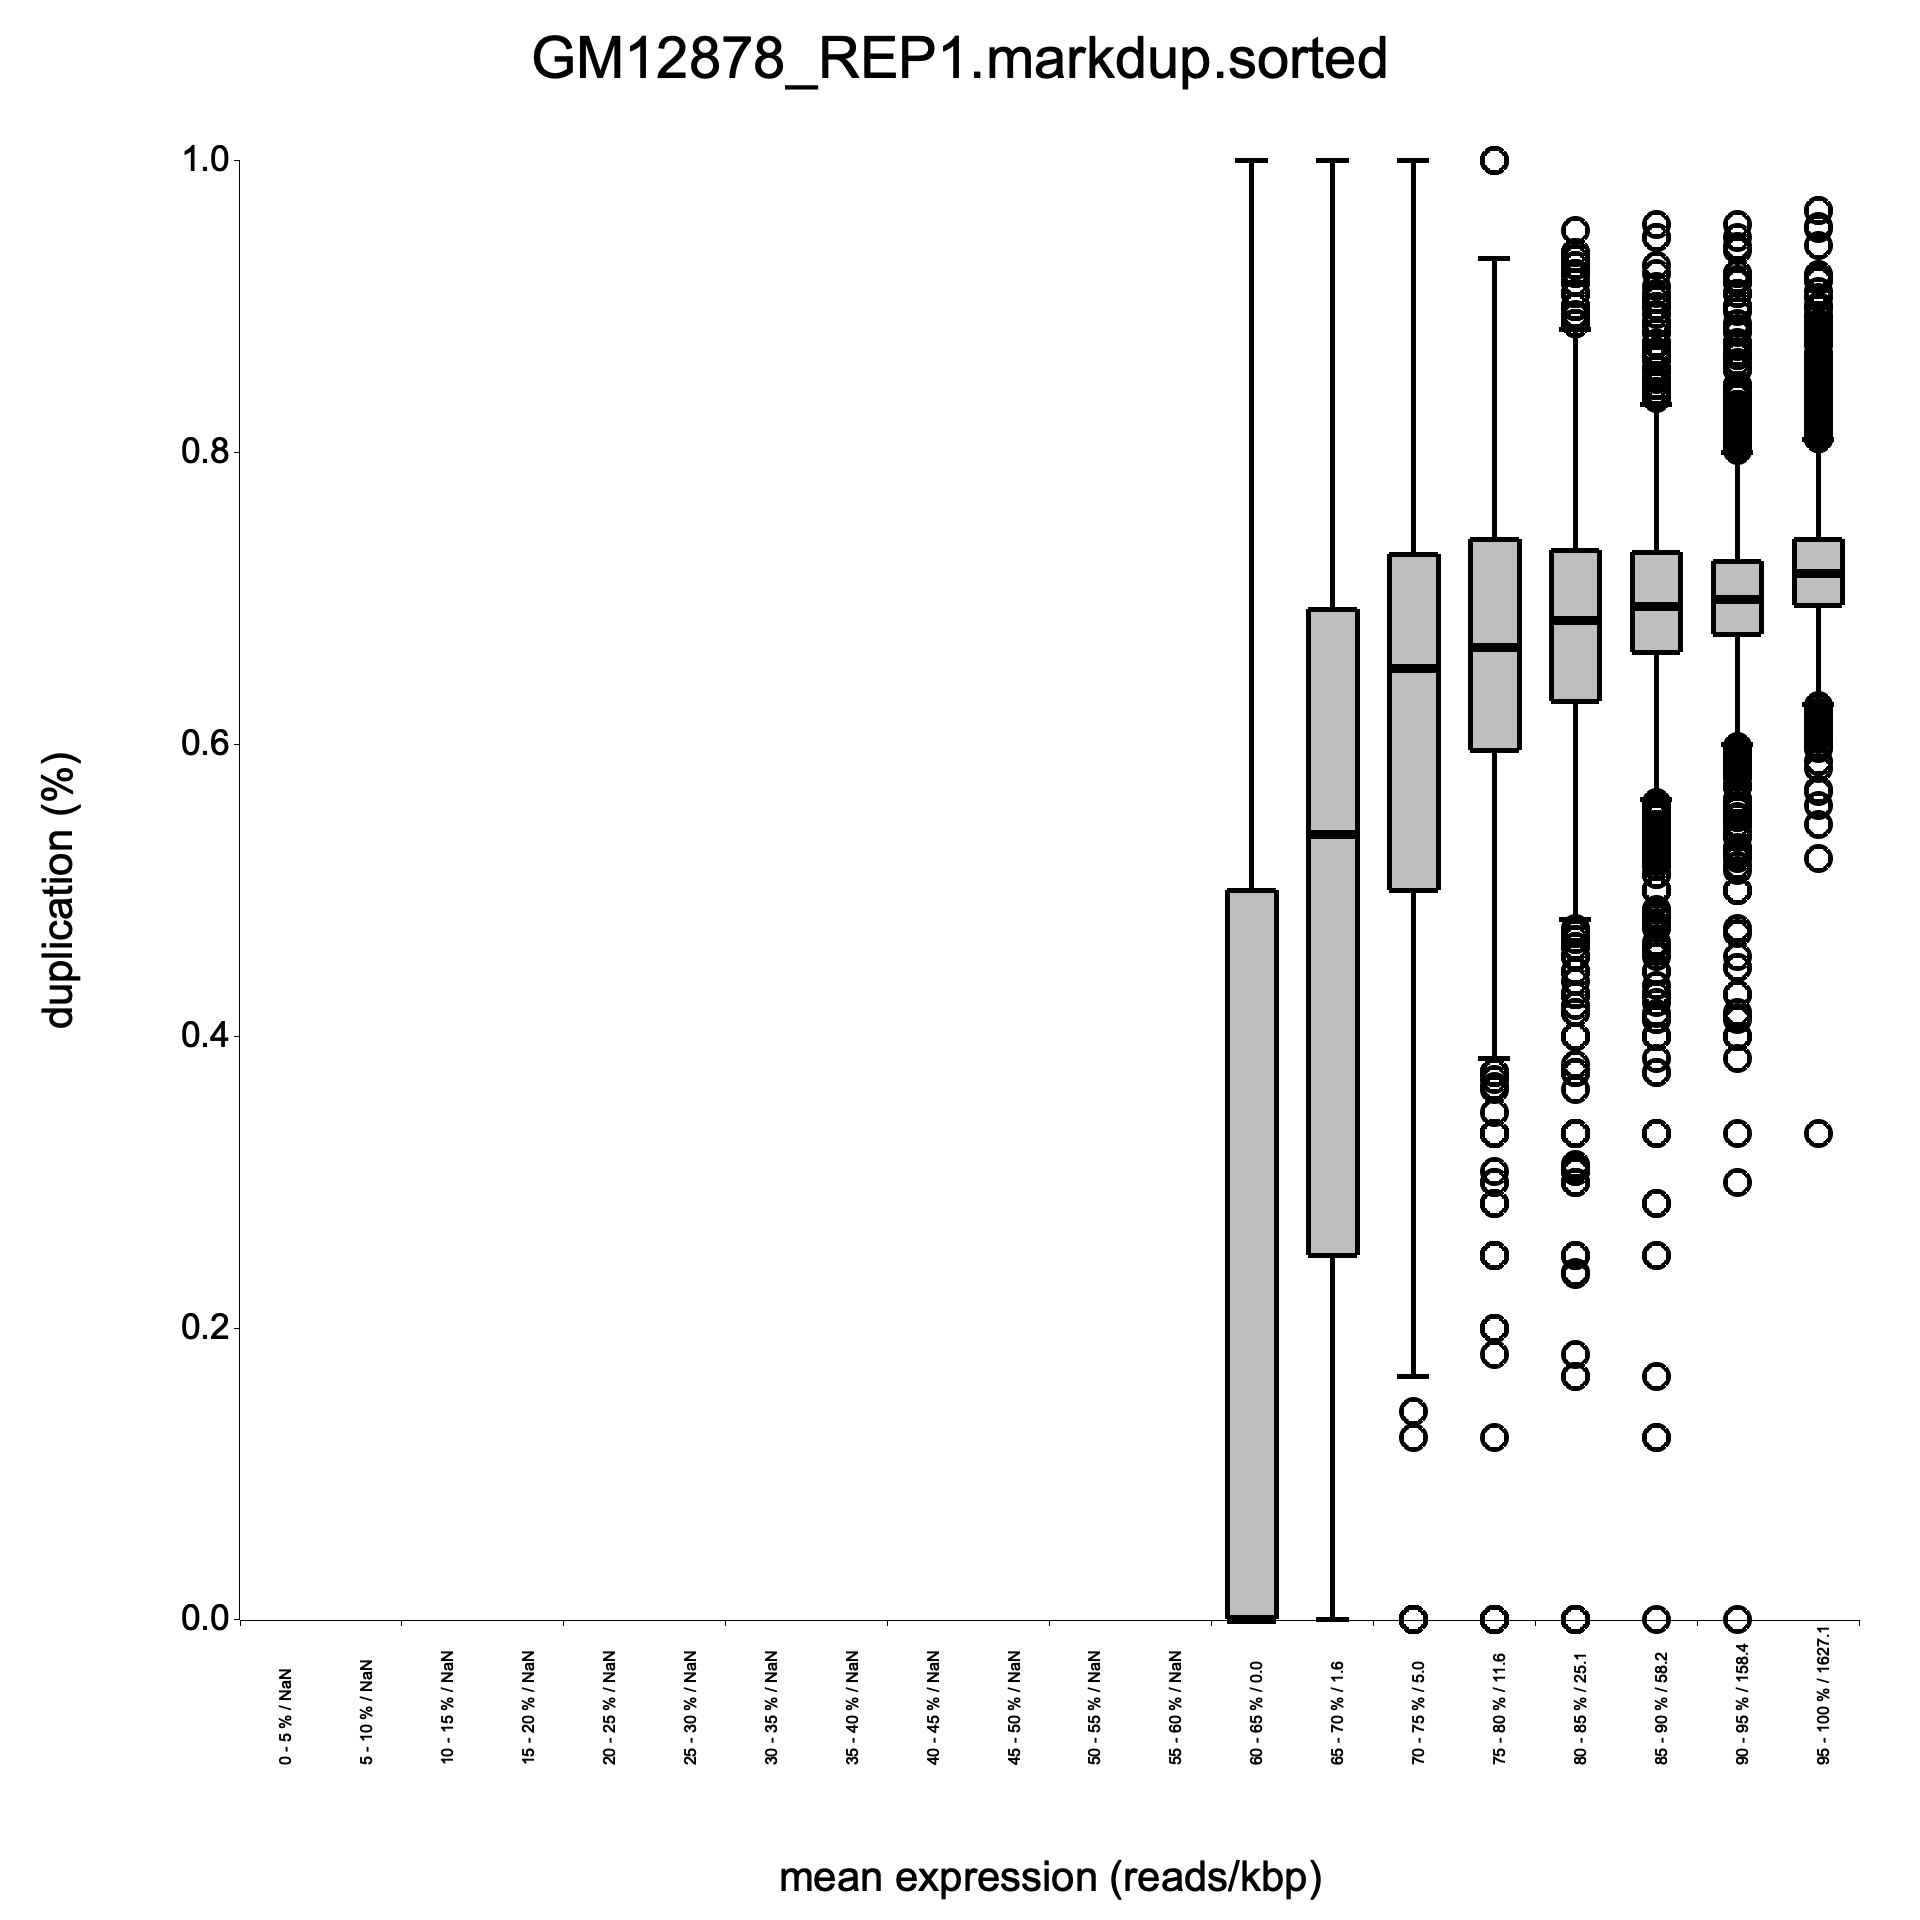
Duplication rate boxplot
Section titled “Duplication rate boxplot”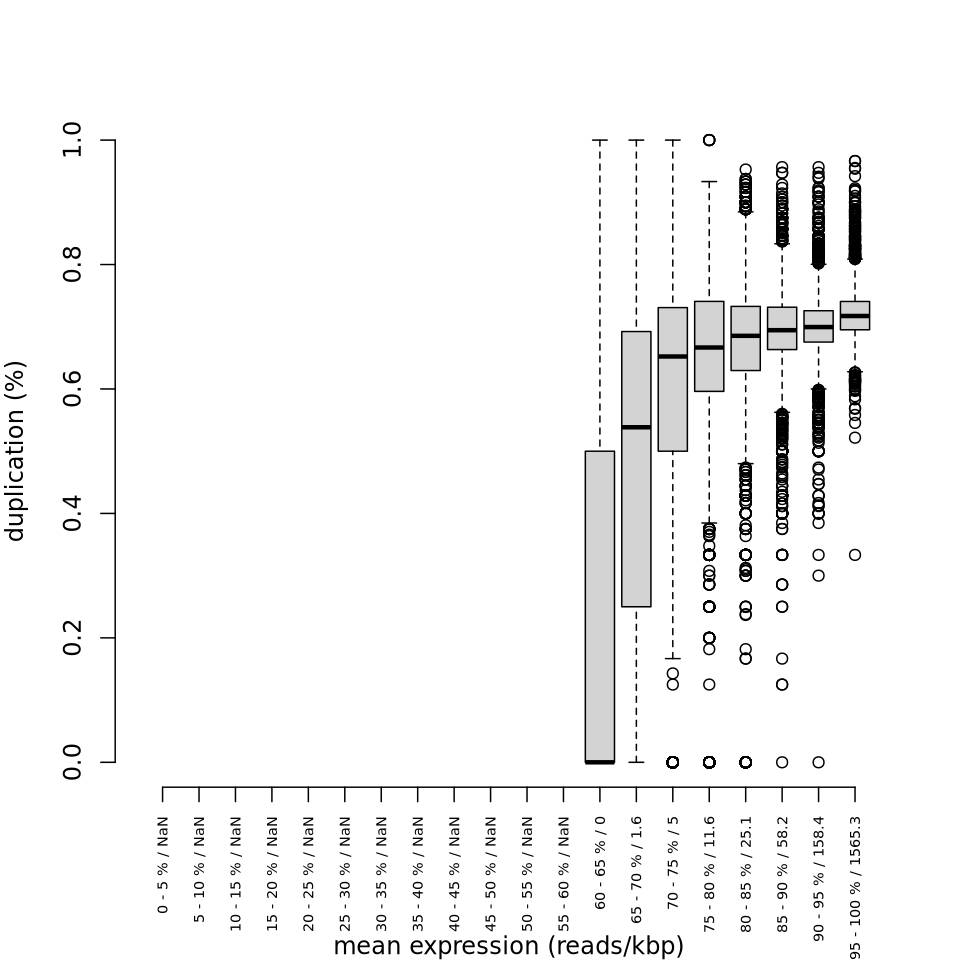
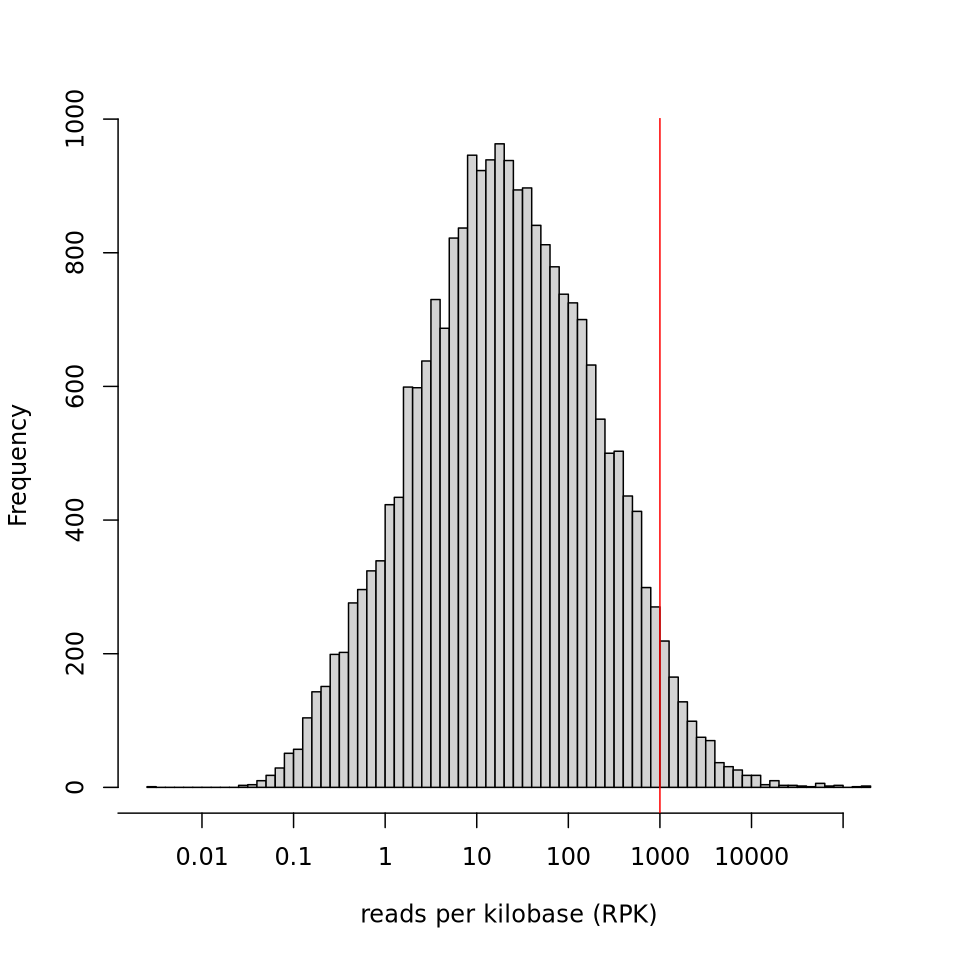
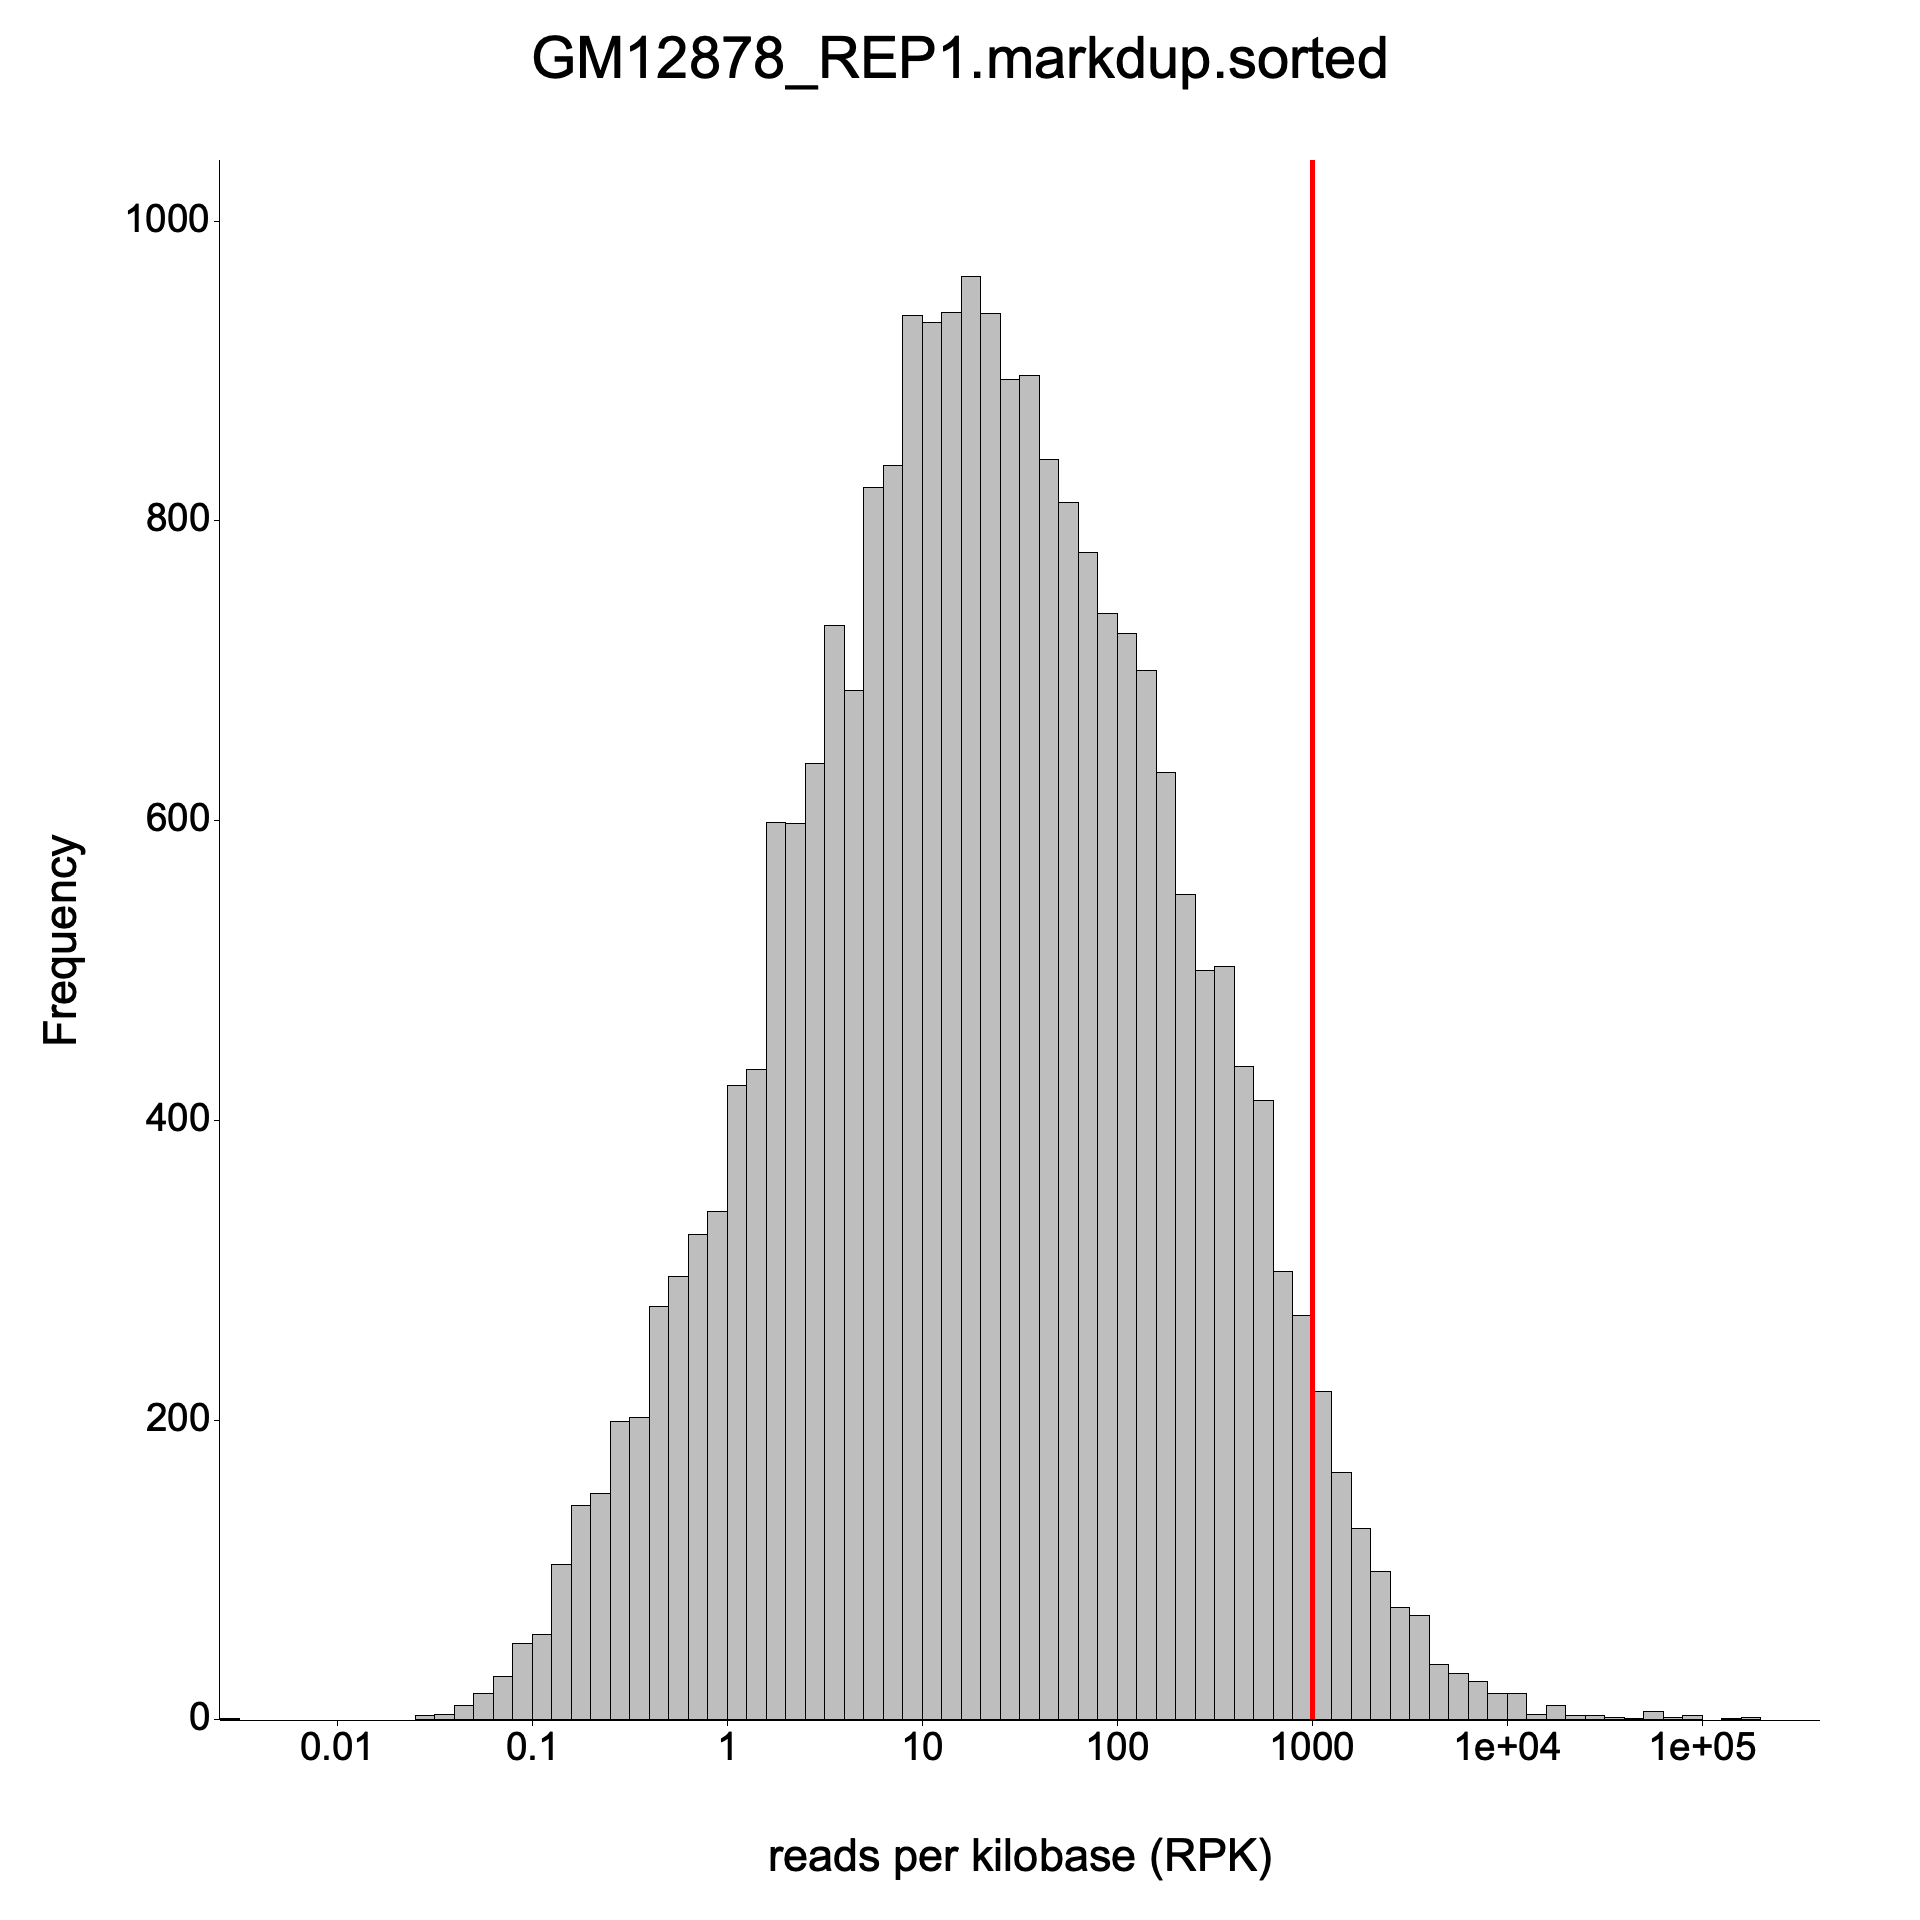
Expression histogram
Section titled “Expression histogram”